
Strategy Builder, Rolling Straddle, Volume APEX, Z-Score, Advance Option Chain, Open Interest Chart, Market Sentiment with Greeks, FII DII Data, Delta Gamma Vega Exposure, and much more
Be part of a growing community making smarter options trading decisions every day.
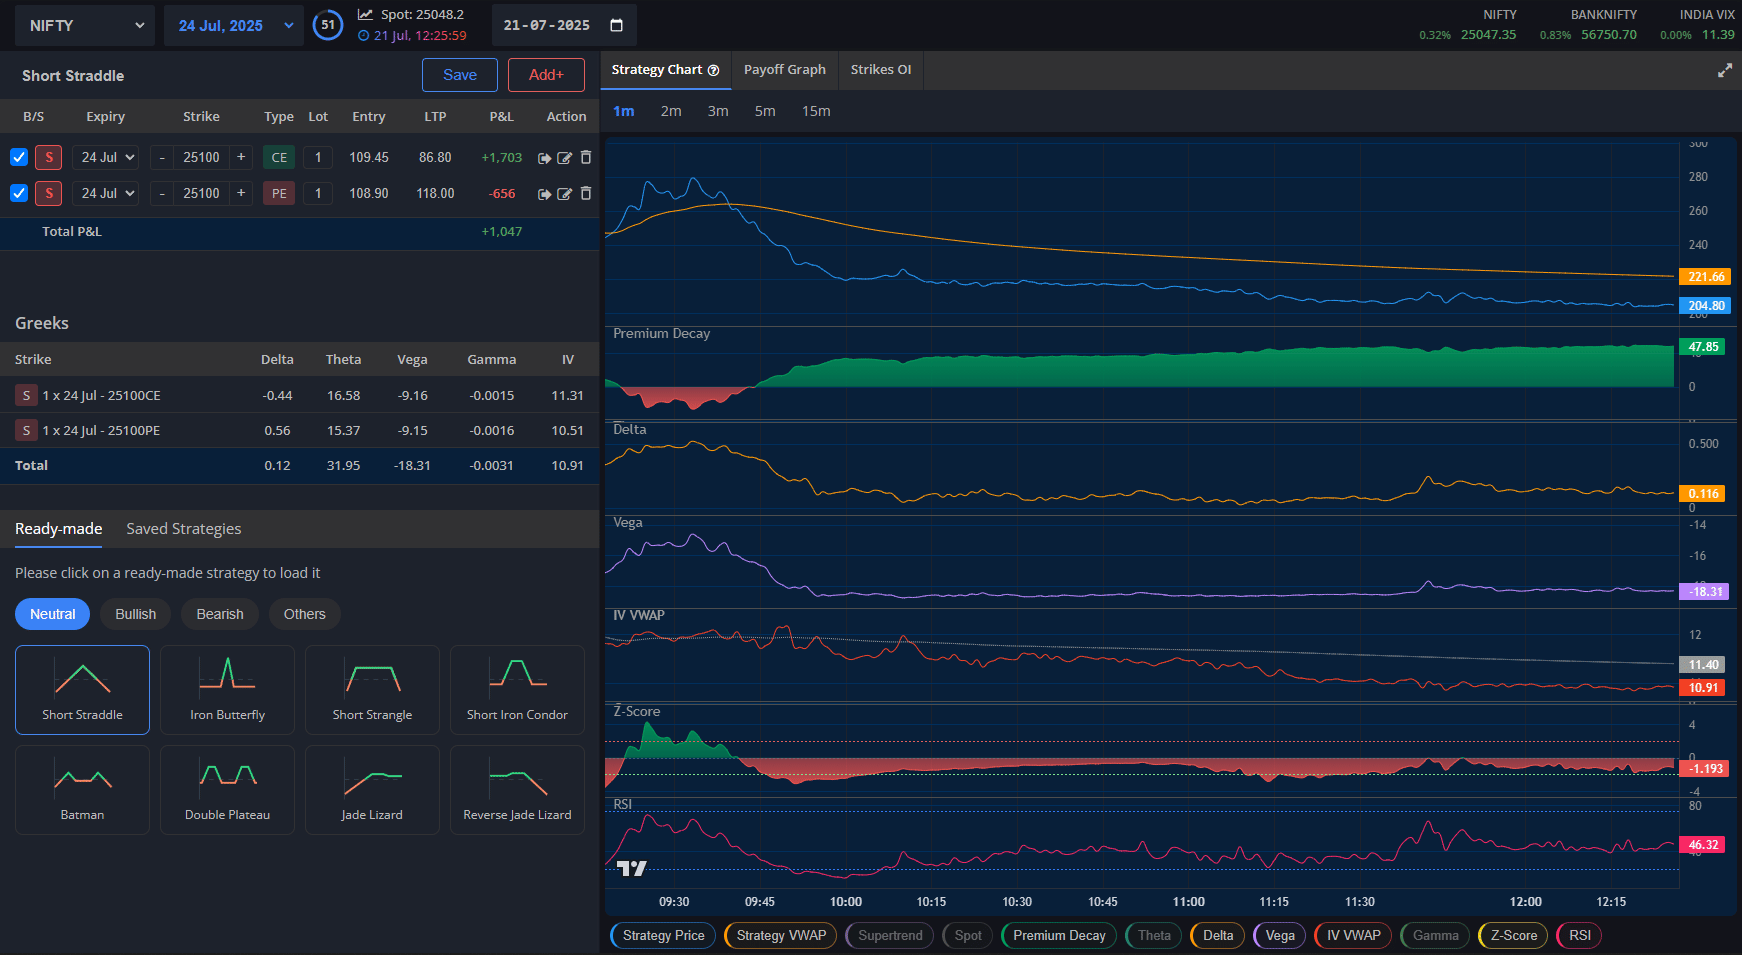
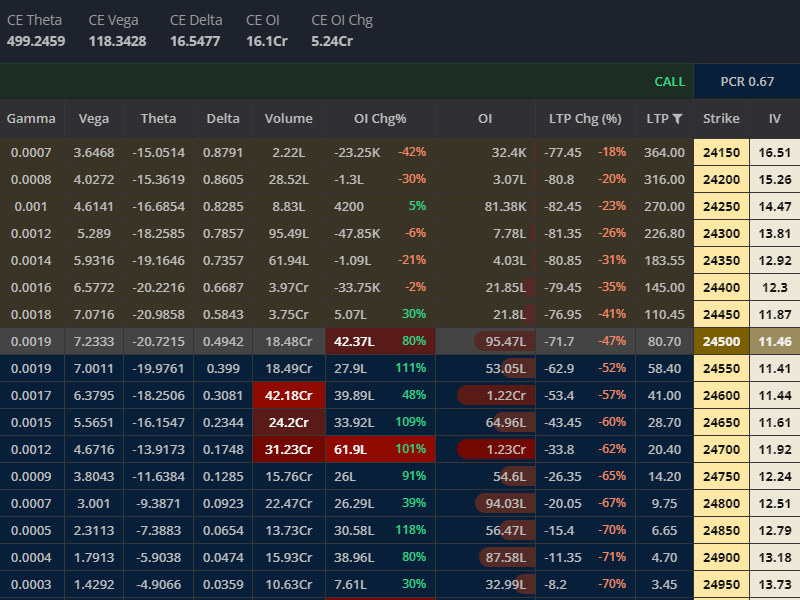
Option Greeks are key indicators in options trading that show how an option's price reacts to different factors. Delta measures price movement with the underlying asset, Gamma shows how fast Delta changes, Theta reflects time decay, Vega tracks sensitivity to volatility, and Rho relates to interest rates. Together, they help traders assess risk and make informed decisions.
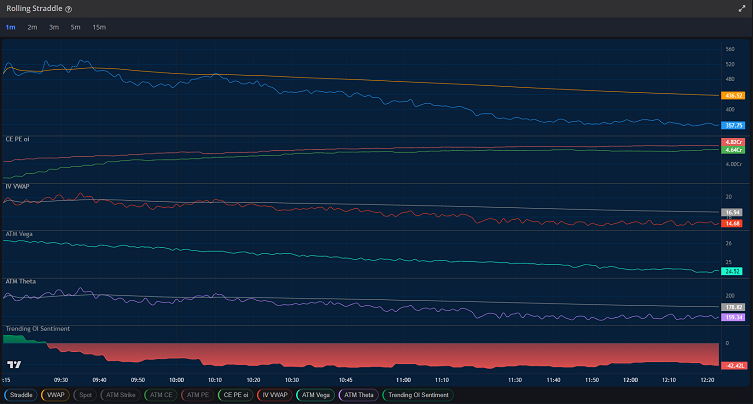
A "rolling straddle" in options trading is a strategy where you repeatedly sell and buy straddles to maintain a position that benefits from increased volatility, but with the ability to adjust your position as the expiration date approaches.
You can analyse Rolling Straddle chart using below options.
 Rolling StraddleATM VegaATM ThetaRolling Straddle VWAPCall Put OIExpiry IVIV VWAPATM CE PE PriceSpotEMARSIZ-ScoreATM Premiun Decay chartATM Premiun Decay VWAPATM Premiun Decay Baseline
Gamma Exposure Dashboard pulls up volume, open interest, and gamma across multiple strikes for the same symbol.
Gamma ExposureGEX LevelsVolumeOIChange OIDifferent TimeframeNet Gamma Exposure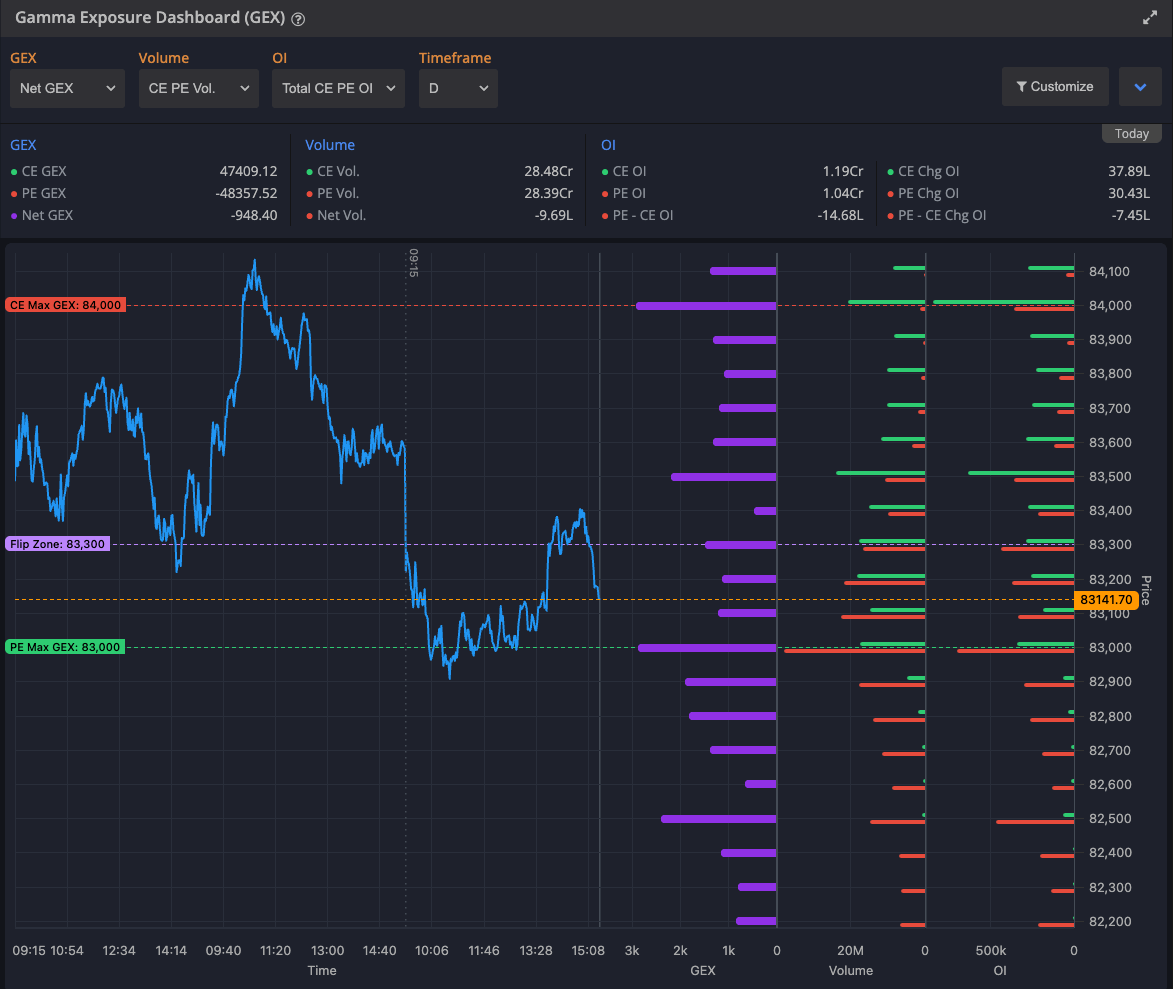
The Z-Score is a statistical measure that tells you how far a value is from the mean, in terms of standard deviations. It's used to identify overbought/oversold conditions relative to historical behavior.
Spot / VWAPZ-Score with STD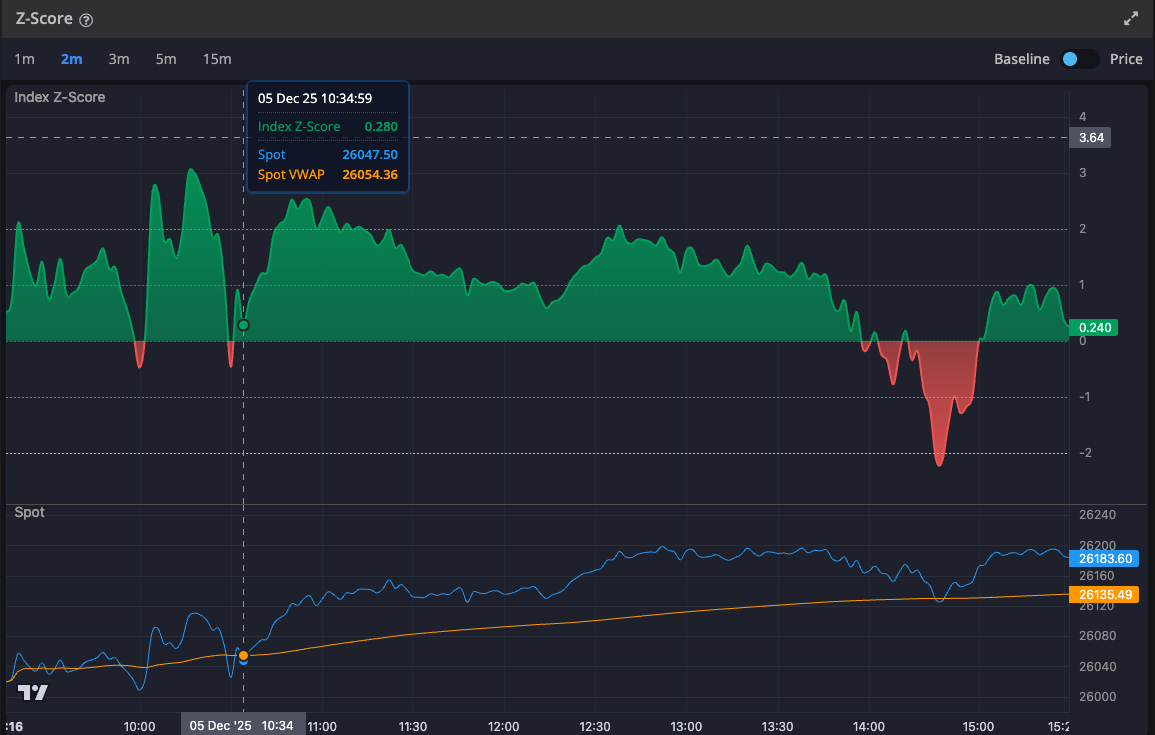
Gamma density refers to the probability density function (PDF) of the gamma distribution, a continuous probability distribution used to model waiting times or non-negative random variables. Its shape depends on shape and scale parameters.
Buy Sell Gamma ExposureNormalized GammaDay High LowGamma Zone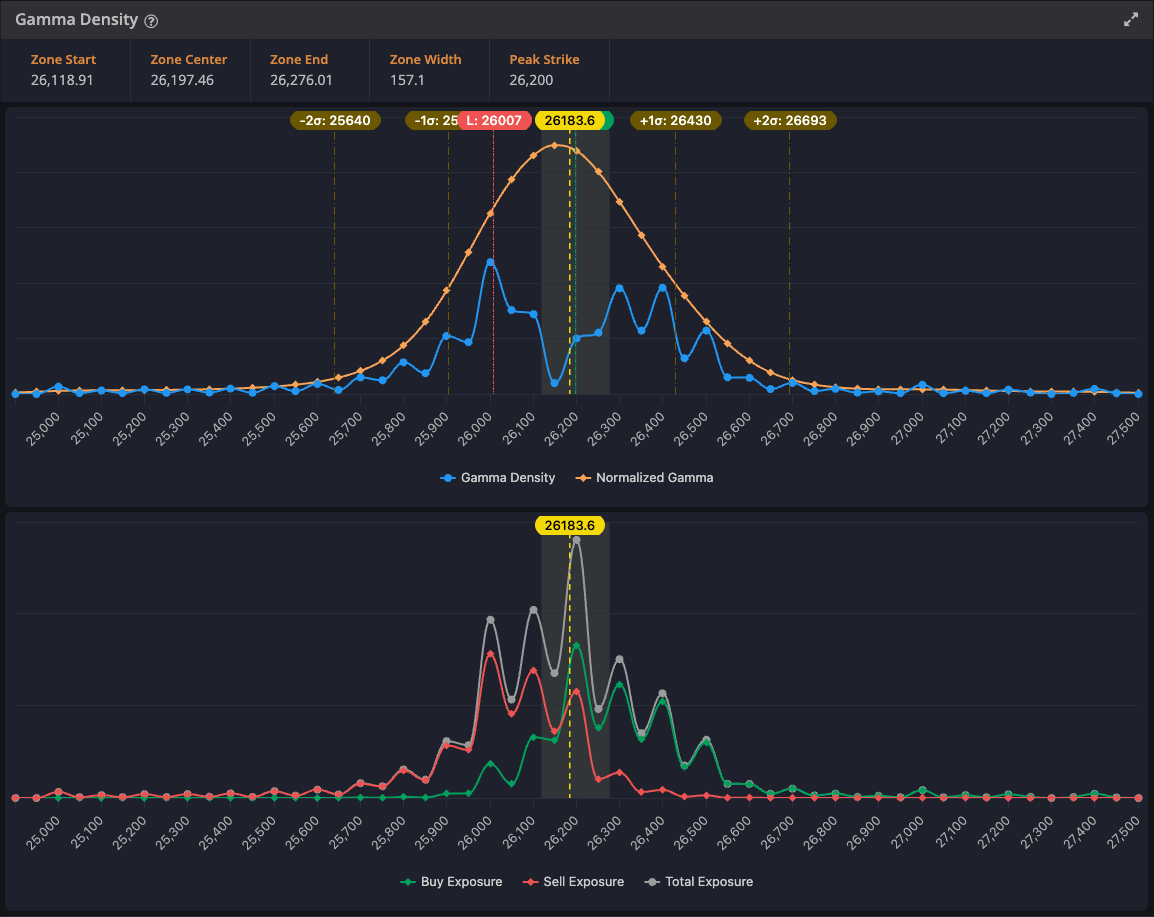
The dashboard showcases a F&O Sector Screener with a bar chart comparing average sector performance. Financial Services, Construction, and Metals & Mining lead with strong gains, while Consumer sectors and Airlines decline. A Healthcare tooltip shows mixed stock performance. Below, sector cards display key stocks with price changes, open interest data, and volumes for quick market insight.
F&O sector stocksSector wise Gainers / LosersSector % ChangeIntraday BoostYesterday BreakoutToday BreakoutRS-Factor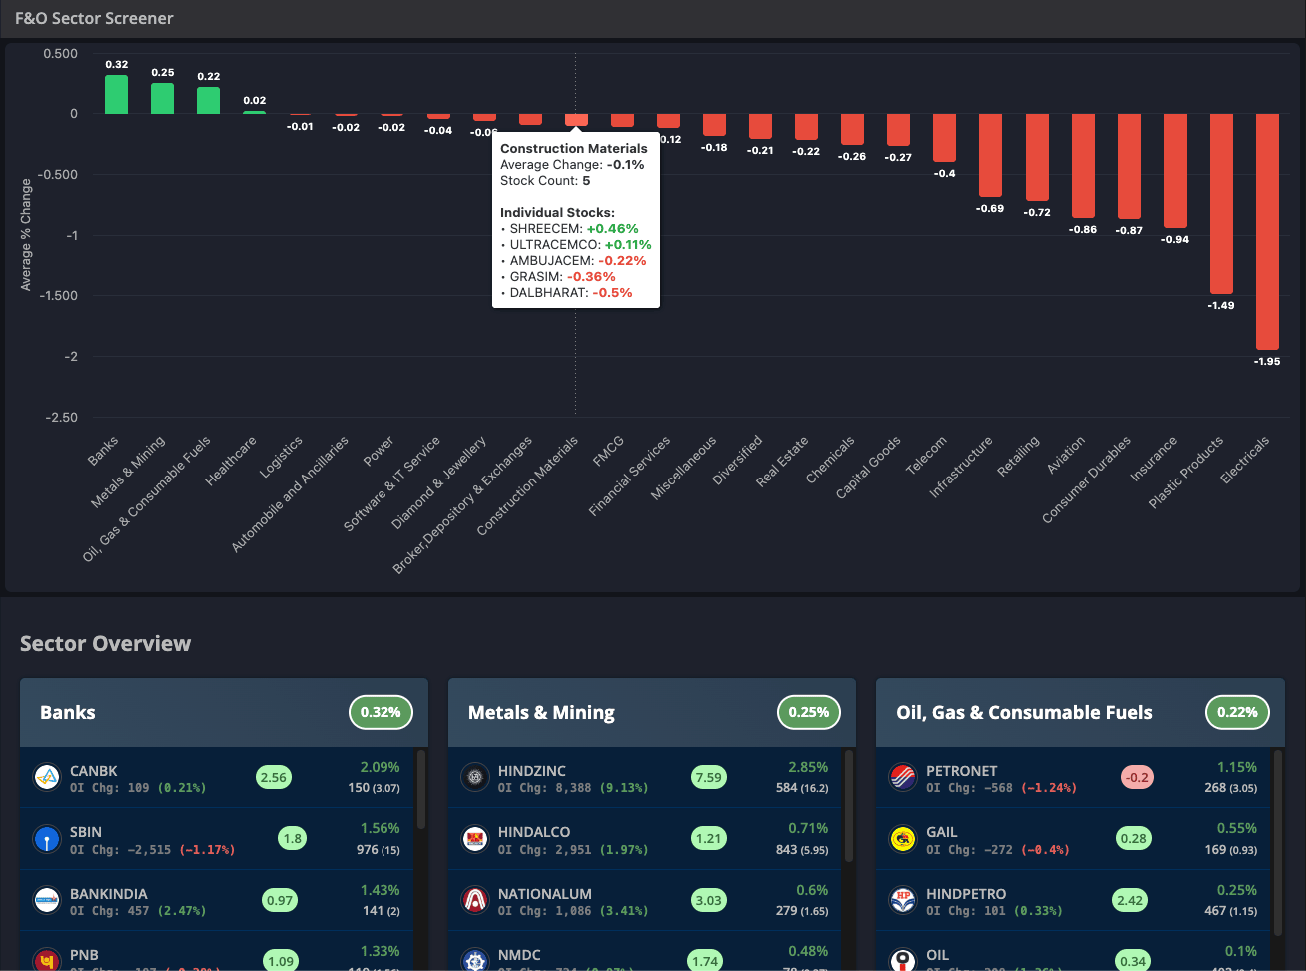
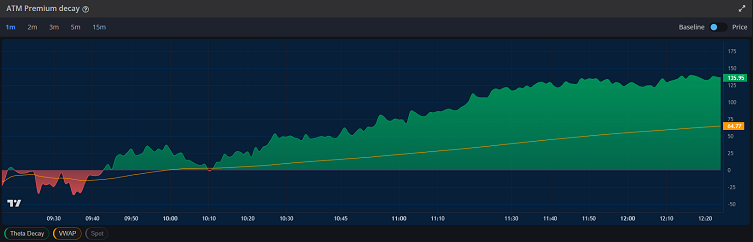
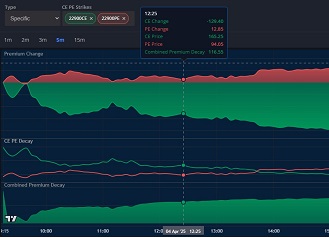
Using the straddle chain approach, an investor takes positions in both a call and a put with the same strike price and maturity date. Total decay, OTM decay and OI also check for CE and PE.
ATM ± 2% straddleToday decayTotal Open interest and OI changeNet Delta and VegaOTM decay and OI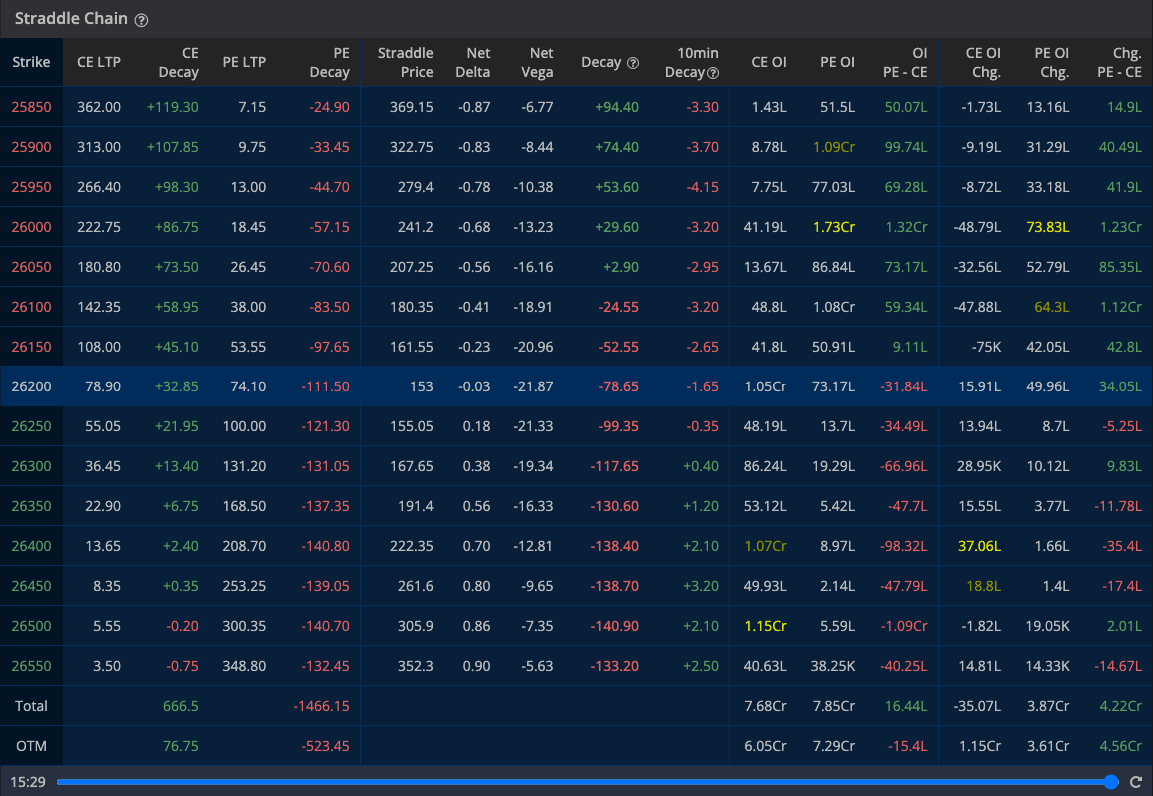
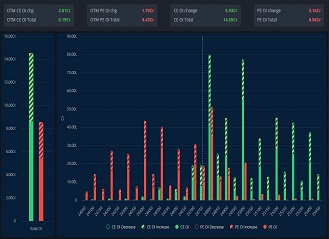
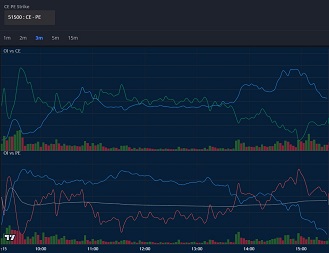
OI Stats offer visual insights into the OI buildup and Unwinding for Call (CE) and Put (PE) options across various strike prices. This helps traders support/resistance zones, and unusual activity.
Total OI and Today OI changeToday MIN and MAX OIHigh OI Zone for Call and PutDay High and Low68% probability zone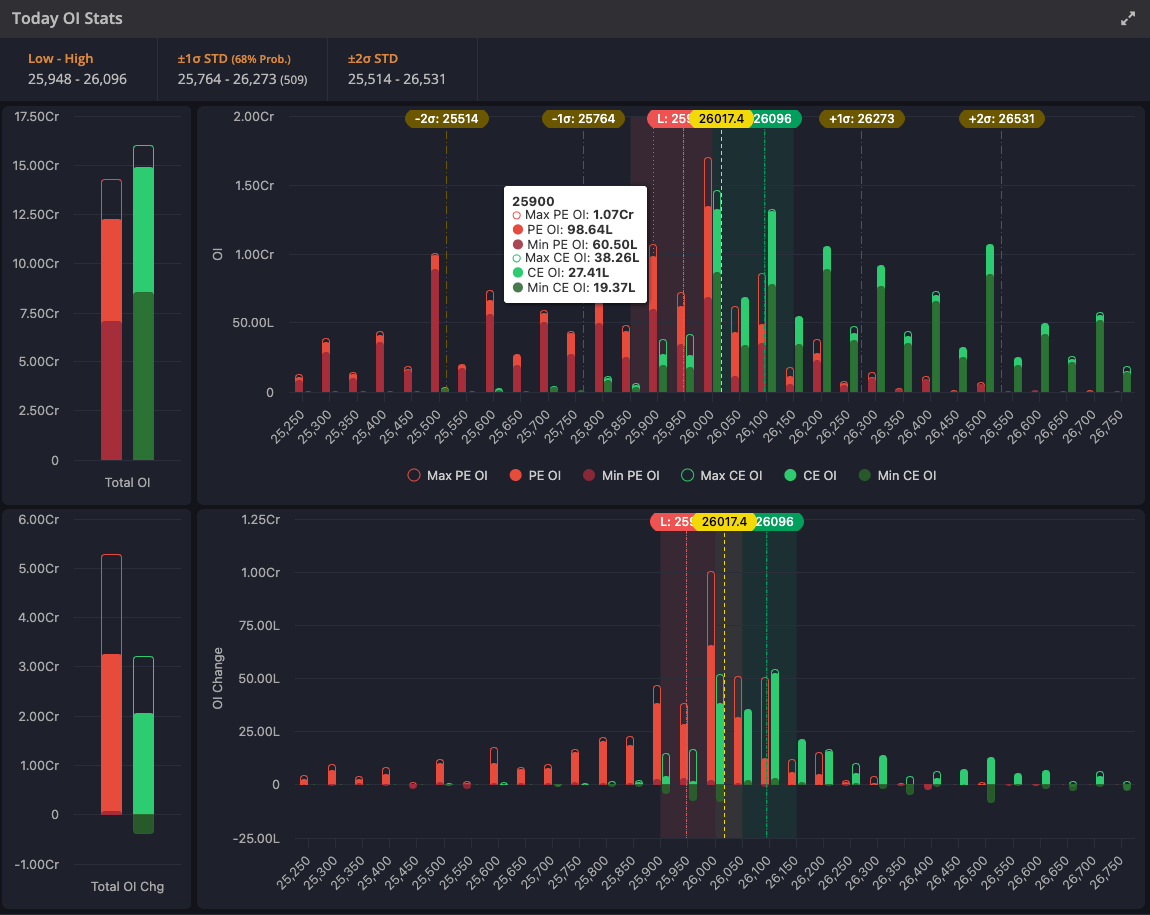
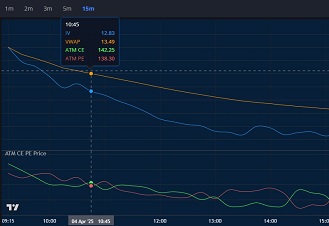
This helps in identifying market trends, sentiment shifts, and potential price movements based on the early trading session's option pricing dynamics.
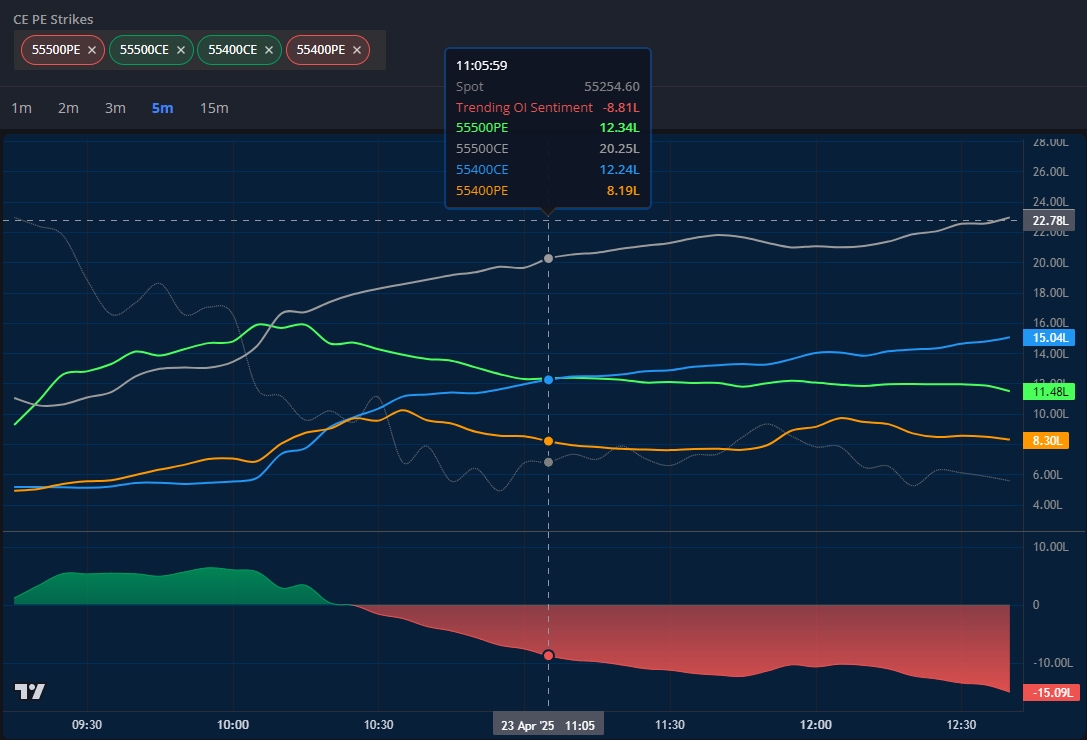
Multistrike OI analysis in Options refers to the analysis of open interest (OI) data for multiple strikes within a particular options contract.
Analyzing ATM IV trends enhances trading skills and improves market direction predictions, providing a better edge for making informed decisions.
We analyze ATM options along with strikes extending 5% on both sides to assess market trends and potential movements effectively.
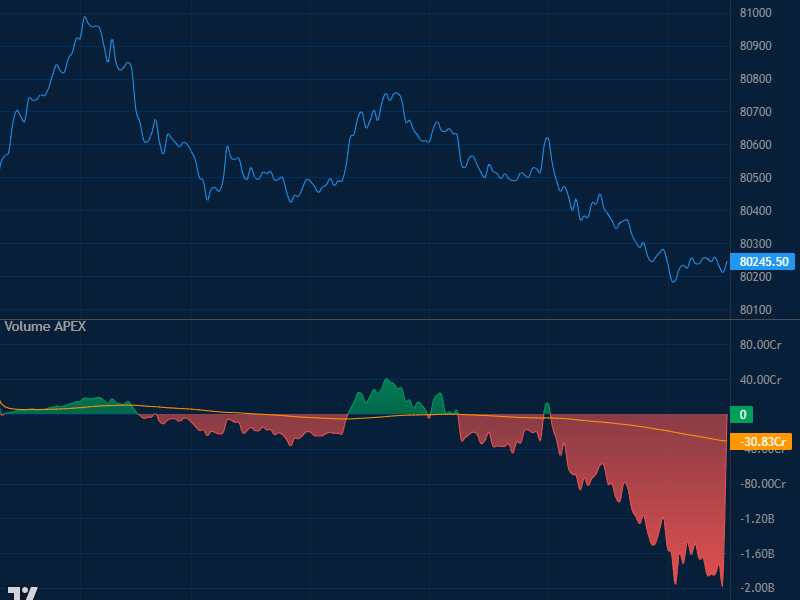
Volume APEX gives insight into market sentiment by factoring in not just how much was traded (volume), but also how directionally significant those trades were (via delta).
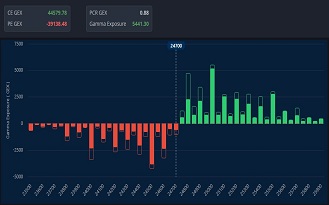
Gamma Exposure (GEX) is the estimated value of gamma exposure that market makers must hedge for every 1% change in the underlying stock's price movement.
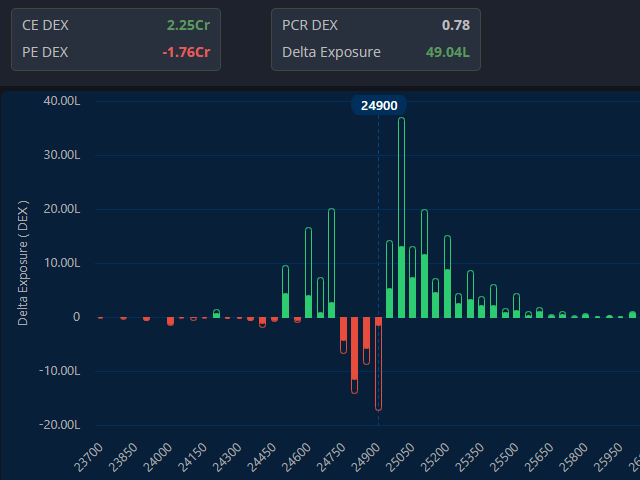
Option dealer delta exposure converts option trading size to an equivalent index volume (bought or sold).
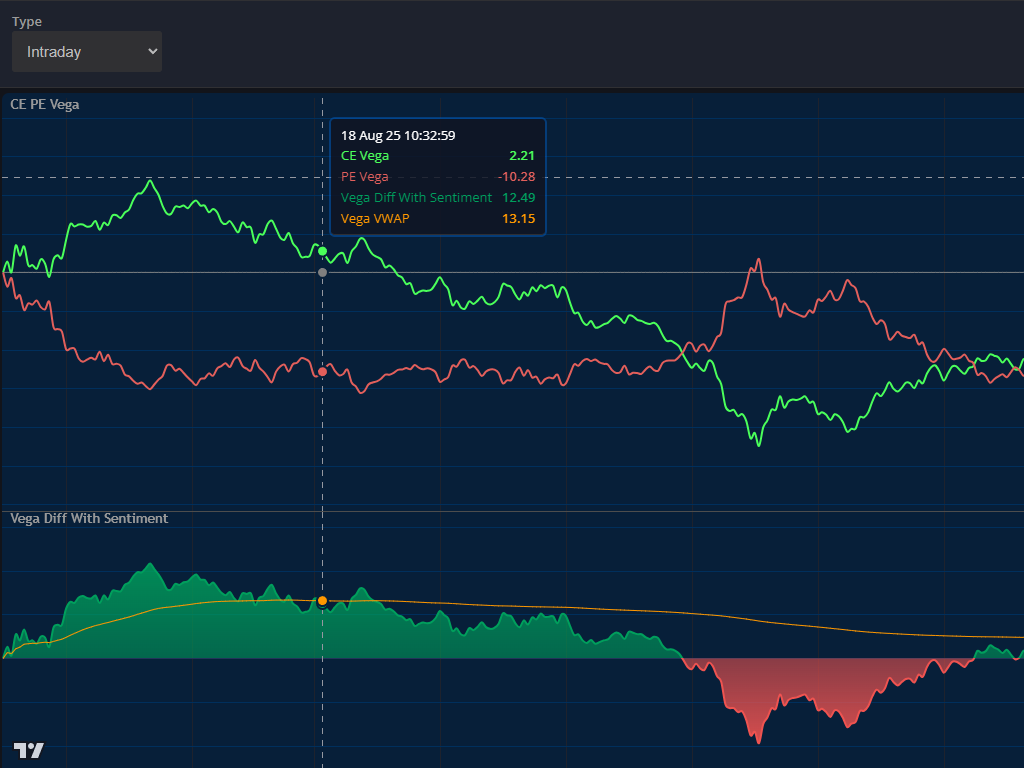
Vega Pulse visualizes the real-time movement of Call and Put Vega, highlighting the volatility sensitivity of options. It helps identify shifts in market sentiment and potential volatility-driven trading opportunities.
Open interest, a key metric in index options trading, represents the total number of outstanding contracts.
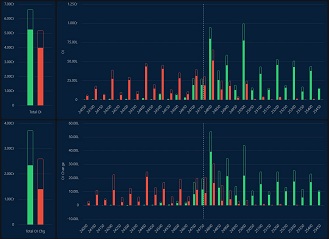
OI Stats offer visual insights into the OI buildup for Call (CE) and Put (PE) options across various strike prices. This helps traders support/resistance zones, and unusual activity.
The profit and loss are projections, and they depend on premium, liquidity, IV, delta, vega, theta etc.
On a chart showing CE and PE Open Interest (OI) and price, a rising price with increasing CE OI suggests strong bullish sentiment.
Rolling Straddle with Premium DecayStraddle - Strangle ChartsStraddle ChainIntraday Expiry wise IV ChartIV Calendar ComparisonVolatility SkewPCR vs IndexVolume PCRVolume APEXTrending OI SentimentAdvance Option Chain with GreeksStrikes Decay / Premium ChangeZ-ScoreVega PulseScalping TrendNet Drift CE PE Premium by valueATM Decay / Premium ChangeMarket Sentiment with Greeks (Θ, ν)Live Max PainOption ChartMultiframe ChartsVolume Exposure (VE)Strike Delta Exposure (DEX)Net Delta Exposure (DEX)Strike Gamma Exposure (GEX)Net Gamma Exposure (GEX)Gamma Density & ConvexityGamma Exposure DashboardStrike Vega Exposure (VEX)Net Vega Exposure (VEX)OI AnalysisOIWAP (Option Interest Weighted Average)Multistrike OIStrikewise OICumulative OIOI vs PriceOI Change vs Total OIToday OI StatsDelta Neutral Strategy (Δ Chart)Delta Neutral Vega Positive StrategyCustom Strategy Builder36+ Ready-made StrategyStrategy with Greeks ( Θ, ν, Γ ) chartStrategy SupertrendStrategy RSIStrategy VWAPStrategy Strikes OIPayoff GraphSave Custom Strategy"This tool revolutionized my options strategy. The Greek calculations are spot on and lightning fast."
"As a beginner, this platform made understanding Greeks approachable. Now I trade with confidence.😊"
"The strategy builder is a game changer. I can test ideas and see Greek impacts in real-time."
We are here to serve you in the best possible way. Do let us know your feedback or your query. We are happy to help you always.
Address: A-1, 2nd Floor, Sunsine Complex, Surat, Gujarat, 394101
Email Us
Everything you need to know about the OptionLab options trading platform and how it works.
The Builder feature in OptionLab is a helpful tool that lets traders easily create and use options trading strategies. It works for both beginners and experienced traders by offering two simple ways to build strategies:
1. Custom Strategy Builder: Users can create their own strategies from scratch by choosing specific options based on their needs.
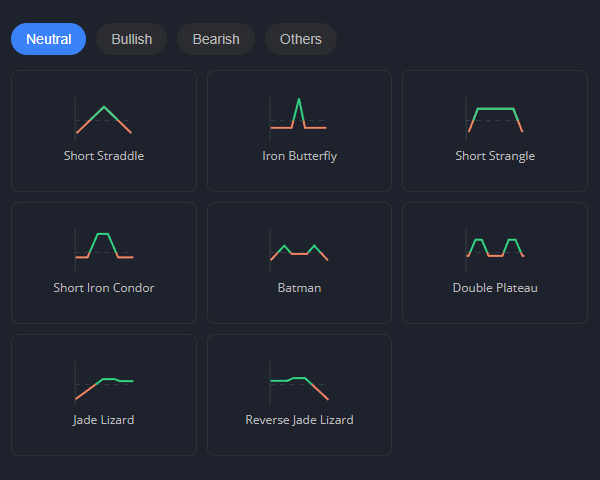
2. 36+ Pre-Built Strategies: Provides ready-made strategies that traders can use instantly without having to build them from the beginning using greeks chart.
3. As per your strategy you can analysis P&L.
