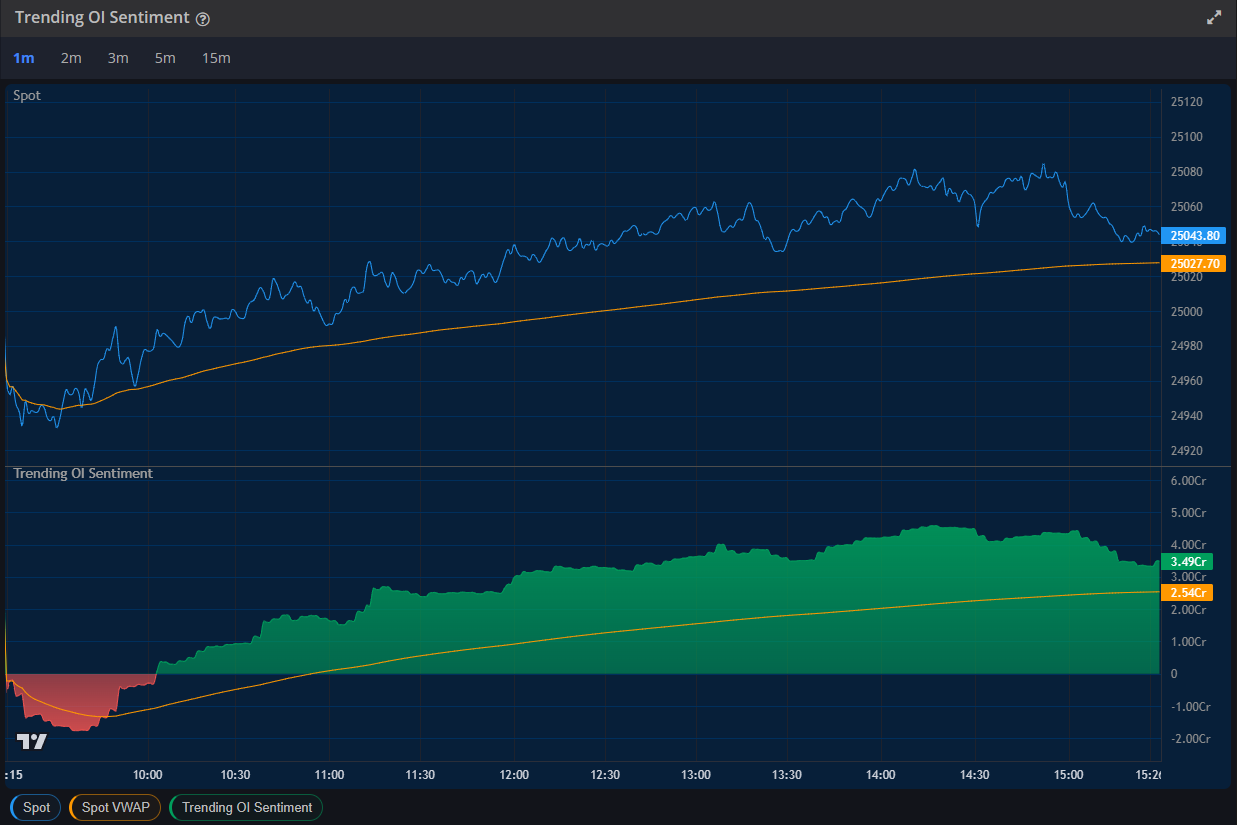
Trending OI (Open Interest) sentiment refers to the analysis of Open Interest data to gauge market sentiment and potential price movements. It involves observing how Open Interest changes in relation to price movements, helping traders identify strong trends, potential reversals, and the overall market participation.
Master the art of Open Interest sentiment analysis with PE-CE change tracking - the ultimate indicator for understanding market direction and institutional positioning in options trading.
Trending OI Sentiment is a sophisticated market sentiment indicator that analyzes the changes in Put-Call Open Interest (PE-CE) to determine the prevailing market bias. It tracks the accumulation and reduction of open interest in put and call options across different strikes and expiries, providing real-time insights into institutional and retail trader positioning for accurate trend prediction.
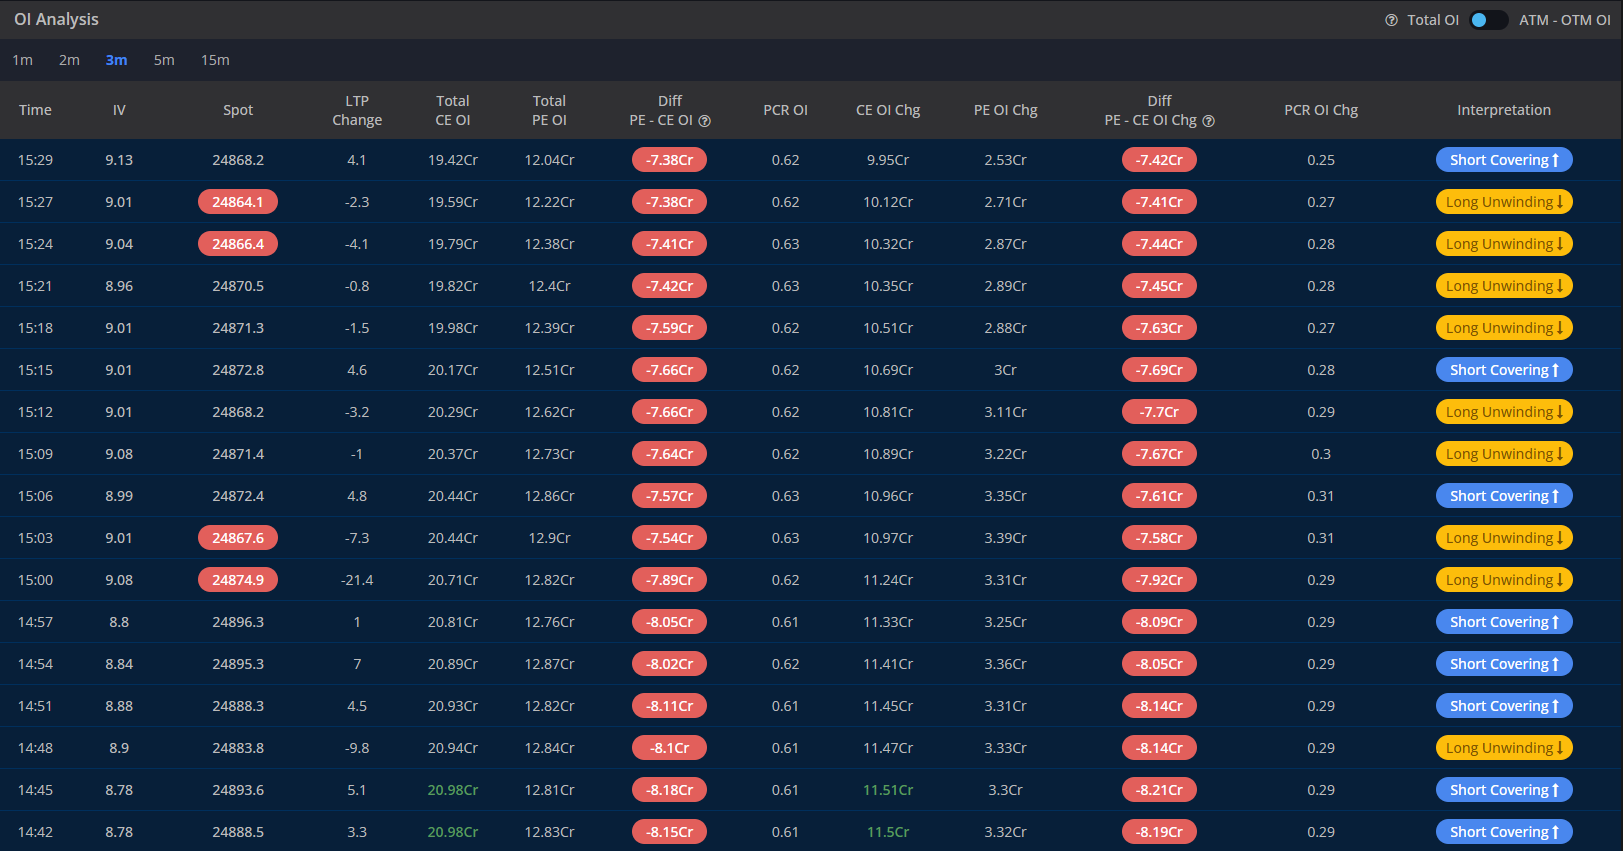
Open Interest represents the total number of outstanding option contracts that have not been settled or closed. Unlike volume, which shows trading activity for a specific period, Open Interest indicates the ongoing commitment of market participants to their positions.
| OI Change Pattern | Price Movement | Market Sentiment | Action Interpretation |
|---|---|---|---|
| Call OI ↓, Put OI ↑ | Price Rising | Strongly Bullish | Put writing, Call unwinding |
| Call OI ↑, Put OI ↓ | Price Falling | Strongly Bearish | Call writing, put unwinding |
| Call OI ↑, Put OI ↑ | Range-bound | Uncertain/Volatile | Hedging activity, event expectation |
| Call OI ↓, Put OI ↓ | Any direction | Position Unwinding | Profit booking, uncertainty |
The strength of sentiment is determined by the magnitude of OI changes and their correlation with price movements. Larger OI changes indicate stronger conviction from market participants.
Strong Bullish Signal:
Strong Bearish Signal:
Analyzing OI changes across different strikes provides insights into support and resistance levels, target prices, and institutional hedging strategies.
| Strike Position | OI Concentration | Market Implication | Trading Strategy |
|---|---|---|---|
| ATM Calls High OI | Current price level | Immediate resistance/support | Range trading, gamma scalping |
| OTM Calls Building | Higher strike prices | Upside target identification | Breakout trades, call spreads |
| ATM Puts High OI | Current price level | Defensive positioning | Protective strategies |
| OTM Puts Building | Lower strike prices | Downside protection/target | Bear spreads, protective puts |
Use OI Sentiment to confirm price trends and identify high-probability continuation or reversal points.
Before earnings, policy announcements, or major events, OI patterns reveal market expectations and positioning.
| Event Type | Pre-event OI Pattern | Expected Outcome | Post-event Strategy |
|---|---|---|---|
| Earnings Release | High Straddle OI buildup | High volatility expected | Volatility crush plays |
| Policy Decision | Directional OI imbalance | One-sided move anticipated | Trend following strategies |
| Expiry Approach | Max Pain concentration | Pin risk at key levels | Gamma hedging required |
| Market Volatility | Put protection increase | Defensive positioning | Safe haven strategies |
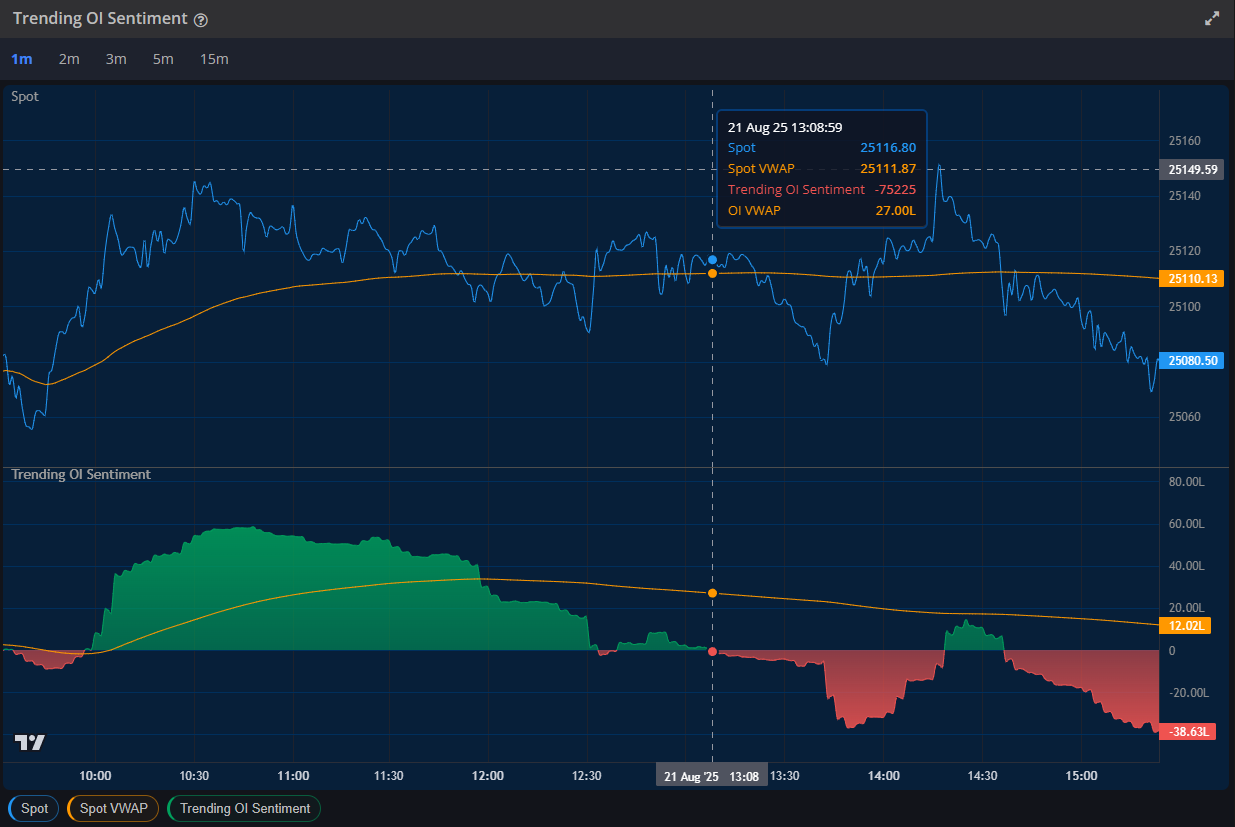
When price action and OI sentiment move in opposite directions, it often indicates upcoming reversals or continuation patterns.
Trending OI Sentiment analysis represents one of the most powerful tools in options trading, providing direct insights into market participant positioning and future price direction. By understanding PE-CE open interest changes and their implications, traders gain a significant edge in both timing and direction prediction.
Success with OI sentiment analysis requires consistent monitoring, proper interpretation of patterns, and disciplined risk management. The key is to combine OI insights with other technical indicators and maintain awareness of broader market conditions.
OI Sentiment is most powerful when used as part of a comprehensive trading strategy. Focus on high-conviction signals supported by volume, maintain proper position sizing, and always respect your risk management rules for optimal results.