A "Rolling straddle" in options trading is a strategy where you periodically close and re-open a straddle with a new, later expiry date, essentially resetting your bet on a significant price movement.
What is a Rolling Straddle?
A rolling straddle is an advanced options strategy that involves continuously adjusting straddle positions as market conditions change. The strategy aims to capture volatility while managing time decay and directional risk through systematic position adjustments.
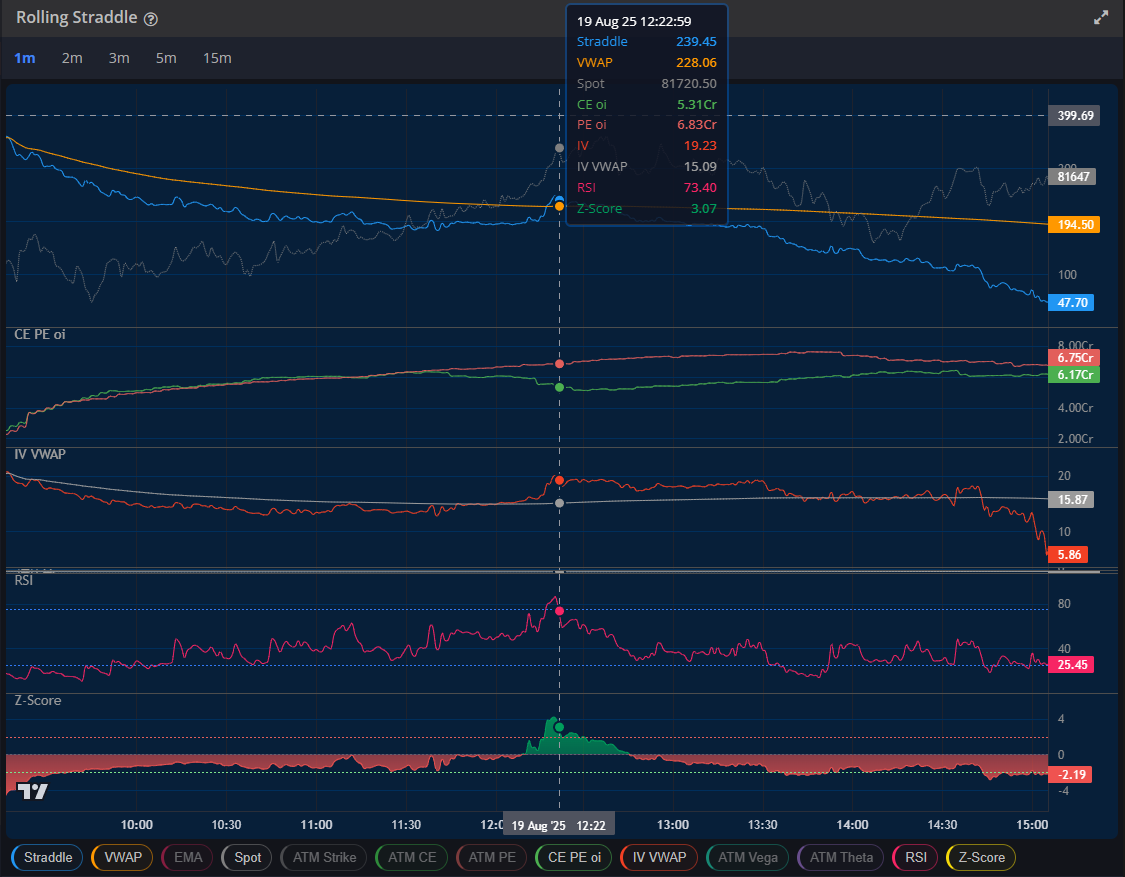
Rolling Straddle Chart with VWAP, EMA, Delta, Z-Score, RSI, Premium Decay, Call Put Price, OI, ATM Strike, Vega and Theta.Rolling Straddle ATM decay Chart: Chart show how many point already decay today.
The straddle chart reveals several critical patterns that traders should monitor closely. The current straddle price of 137.15 shows the market's assessment of volatility premium, which is trading below both the VWAP and EMA levels, suggesting potential undervaluation.
Key Observations from Chart Analysis:
Declining Trend: The straddle has shown a consistent downward trend from higher levels, indicating decreasing volatility premiums
Support Levels: Current price action suggests testing of significant support around the 111-120 range
Volume Pattern: Increased trading activity during price declines indicates active profit-taking or hedging
Technical Indicators: RSI at 44.21 suggests the instrument is approaching oversold territory
Greeks Analysis
Understanding the option Greeks is essential for straddle trading success. The current metrics provide insight into how the position will behave under different market scenarios:
Greek
Current Impact
Trading Implication
Delta Neutral
Approximately 0
Position profits from large moves in either direction
Gamma Exposure
High at ATM strikes
Accelerating profits with significant price movements
Theta Decay
-38.60 (from premium decay chart)
Time decay working against the position
Vega Sensitivity
Positive exposure
Benefits from volatility expansion
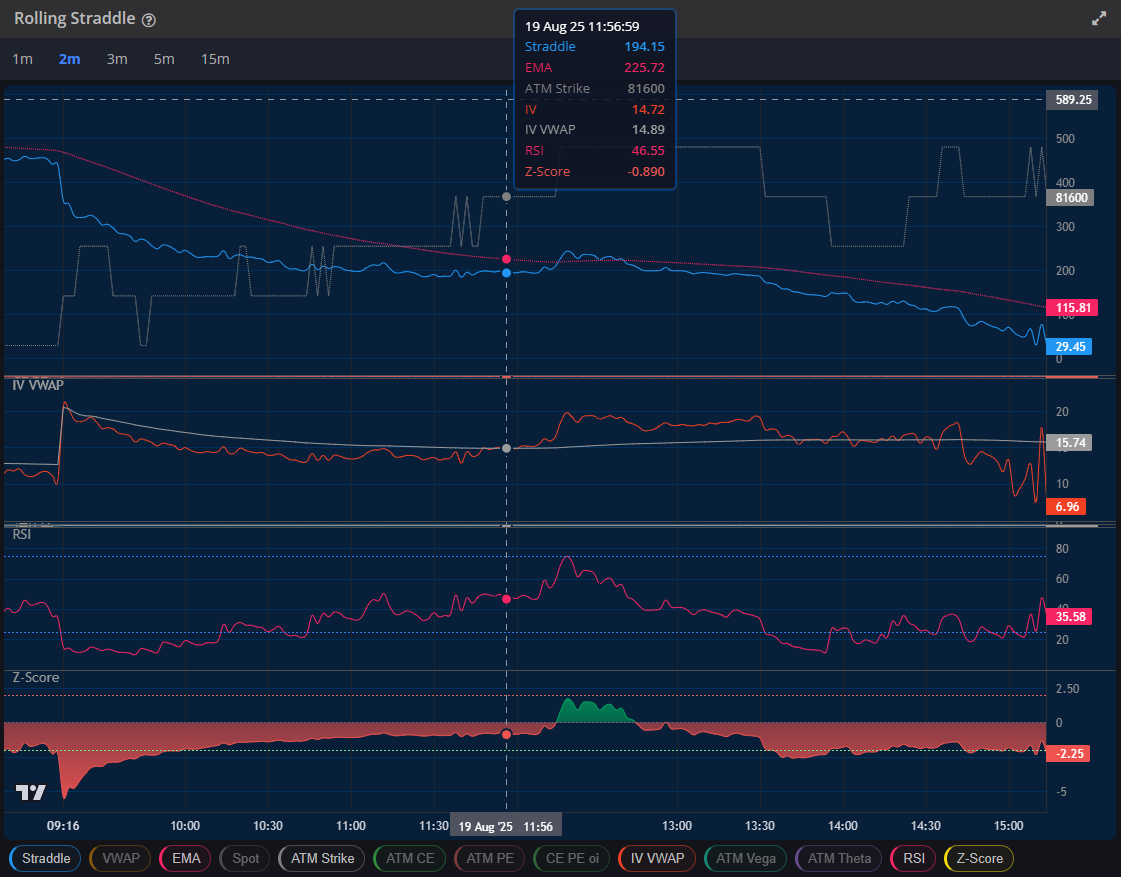
Rolling Straddle Chart with EMA, IV, ATM Strike, Z-score and RSI.
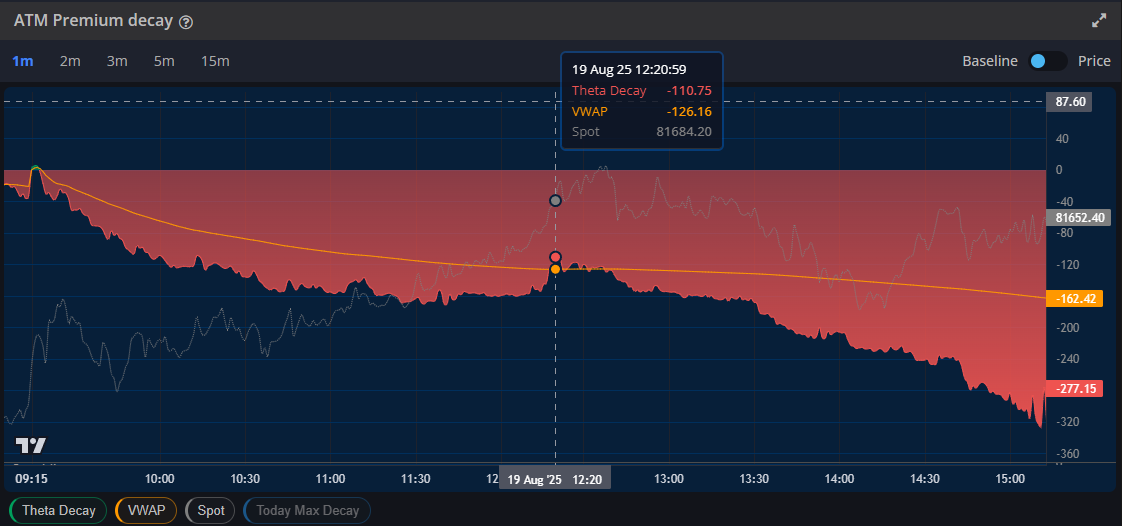
ATM Premium Decay Analysis
The ATM Premium Decay chart illustrates the critical time decay component affecting straddle positions. The current decay rate of -38.60 represents the daily premium erosion that traders must overcome through volatility or directional moves.
Premium Decay Patterns
The premium decay visualization shows several important characteristics that impact straddle profitability:
Accelerating Decay: Premium decay intensifies as expiration approaches, particularly in the final weeks
Volatility Impact: Higher implied volatility periods show slower decay rates
Weekend Effect: Time decay continues over market closures, affecting Monday opening positions
Risk Management Alert: The current decay rate suggests that the underlying asset needs to move more than 3.5% from current levels to overcome daily time decay, making this a high-risk, high-reward scenario.
Market Sentiment Indicators
Volatility Environment
The current volatility environment, as indicated by the IV VWAP of 12.01, suggests relatively low volatility expectations. This creates both opportunities and risks for straddle positions:
Volatility Trading Considerations:
Low IV Environment: Current implied volatility levels may present buying opportunities if volatility expansion is expected
Historical Comparison: Comparing current IV to historical ranges helps assess relative value
Event Risk: Upcoming earnings, economic announcements, or geopolitical events can trigger volatility spikes
Volatility Clustering: Periods of low volatility often precede periods of high volatility
Technical Indicator Summary
The combination of technical indicators provides a comprehensive view of market conditions:
Indicator Type
Current Reading
Signal Strength
Trading Bias
RSI
44.21
Moderate
Approaching Oversold
Price vs EMA
Below EMA
Strong
Bearish Bias
Price vs VWAP
Below VWAP
Moderate
Institutional Selling
Volume
Elevated on Declines
Strong
Distribution Pattern
Rolling Straddle Chart Interpretation Guide
Multi-Timeframe Analysis
The rolling Straddle chart displays various timeframes for comprehensive analysis:
3m: Tactical adjustments - Position management decisions
5m: Standard analysis - Primary trading timeframe
15m: Trend confirmation - Broader market context
Position Sizing and Capital Allocation
Effective straddle trading requires disciplined risk management approaches that account for the unique characteristics of volatility trading:
Portfolio Allocation: Limit straddle positions to 2-5% of total trading capital
Diversification: Spread risk across multiple expiration dates and underlying assets
Liquidity Requirements: Ensure adequate cash reserves for position adjustments
Correlation Analysis: Avoid concentrated exposure to highly correlated instruments
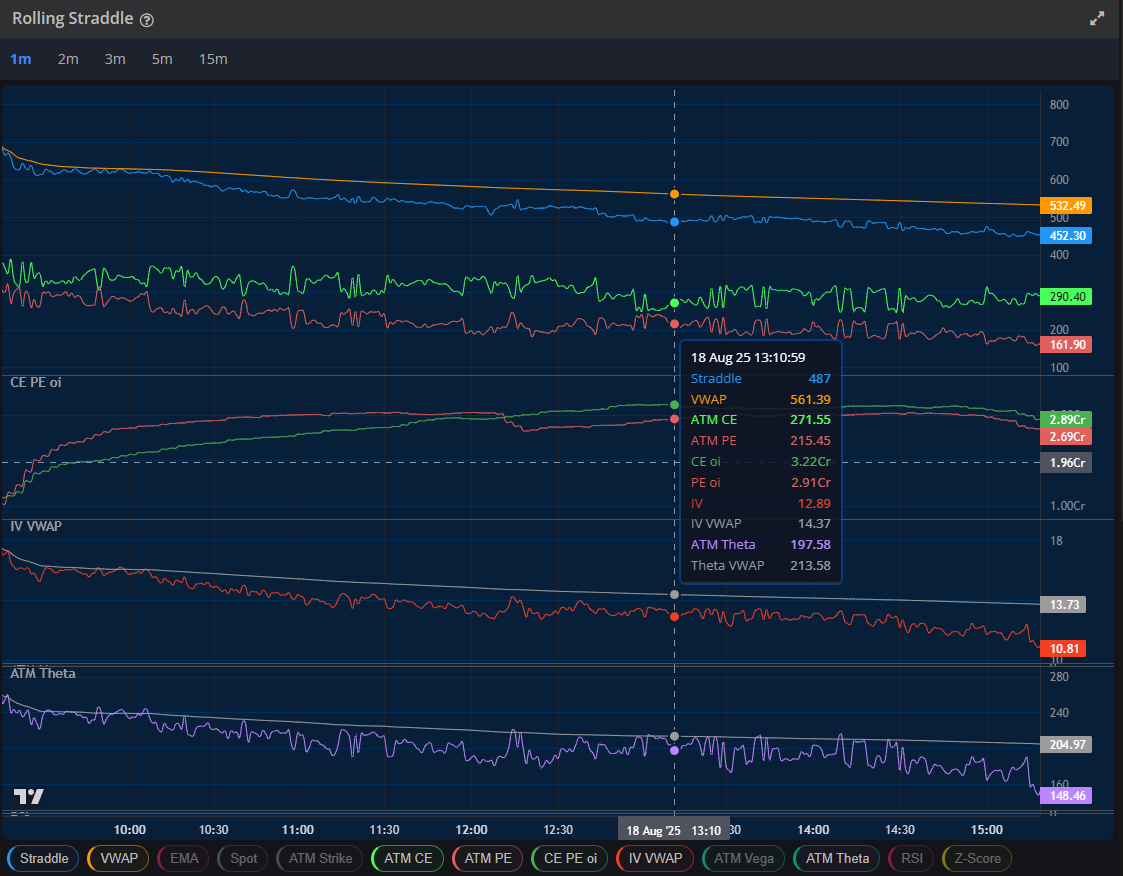
Rolling Strangle Chart with VWAP, OI, Call Put Price, IV, Theta.
Strategic Trading Considerations for Rolling Straddle
Entry Criteria
Volatility Expansion: Enter rolling straddles when implied volatility is below historical averages
Technical Confluence: Look for support/resistance levels that may trigger significant moves
Event Calendar: Time entries around known volatility catalysts
Risk-Reward Ratio: Ensure potential profits exceed time decay and transaction costs
Exit Strategies
Profit Targets: Typically 25-50% of maximum possible profit buying straddle or strangle, 1-1.5% profit selling straddle or strangle.
Time Decay Management: Exit positions with 1-2 weeks remaining to expiration
Volatility Contraction: Close when implied volatility returns to historical high levels
Technical Breakdown: Exit if underlying asset breaks significant support/resistance levels
Risk Management Framework
Risk Factor
Management Technique
Implementation
Time Decay
Position sizing and timing
Avoid holding through final weeks
Volatility Risk
IV rank analysis
Trade in high IV environments
Directional Risk
Delta hedging
Adjust underlying exposure
Liquidity Risk
Strike selection
Choose liquid options contracts
Market Context and Timing
The straddle strategy performs best during specific market conditions:
Optimal Market Conditions
High Volatility Environment: When VIX or volatility indices are elevated
Event-Driven Trading: Before earnings announcements or major economic releases
Market Uncertainty: During geopolitical tensions or policy announcements
Technical Breakouts: At key support/resistance levels
Advanced Rolling Straddle Variations
Calendar Straddles: Using different expiration dates for enhanced flexibility. Diagonal Straddles: Combining different strikes and expiries for customized risk profiles. Ratio Straddles: Employing unequal numbers of calls and puts for directional bias.
Conclusion
The rolling straddle options strategy represents a sophisticated approach to trading volatility rather than direction. Success requires careful analysis of multiple factors including implied volatility, time decay, delta positioning, and market timing.
Z-Score Monitoring: Track Z-Score levels for optimal entry timing
Premium Decay Analysis: Monitor combined premium decay for position health
Multi-Timeframe Approach: Use multiple timeframes for comprehensive analysis
High Volatility Focus: Target high volatility environments for maximum profit potential
Technical Integration: Combine with technical analysis for enhanced precision
By mastering these concepts and utilizing advanced charting tools, traders can effectively implement straddle strategies to capitalize on market volatility while managing associated risks.
This tool is available as part of the subscription. Please Click here to subscribe.