Vega Pulse visualizes the real-time movement of Call and Put Vega, highlighting the volatility sensitivity of options. It helps identify shifts in market sentiment and potential volatility-driven trading opportunities.
Vega Pulse is a comprehensive volatility analysis tool that helps traders understand how option premiums respond to changes in implied volatility. It provides real-time insights into CE (Call) and PE (Put) vega behavior, enabling better trading decisions in volatile markets.
Vega Pulse represents the heartbeat of options volatility, measuring how sensitive option prices are to changes in implied volatility. Vega measures the amount of increase or decrease in an option premium based on a 1% change in implied volatility, making it crucial for traders to monitor during volatile market conditions.
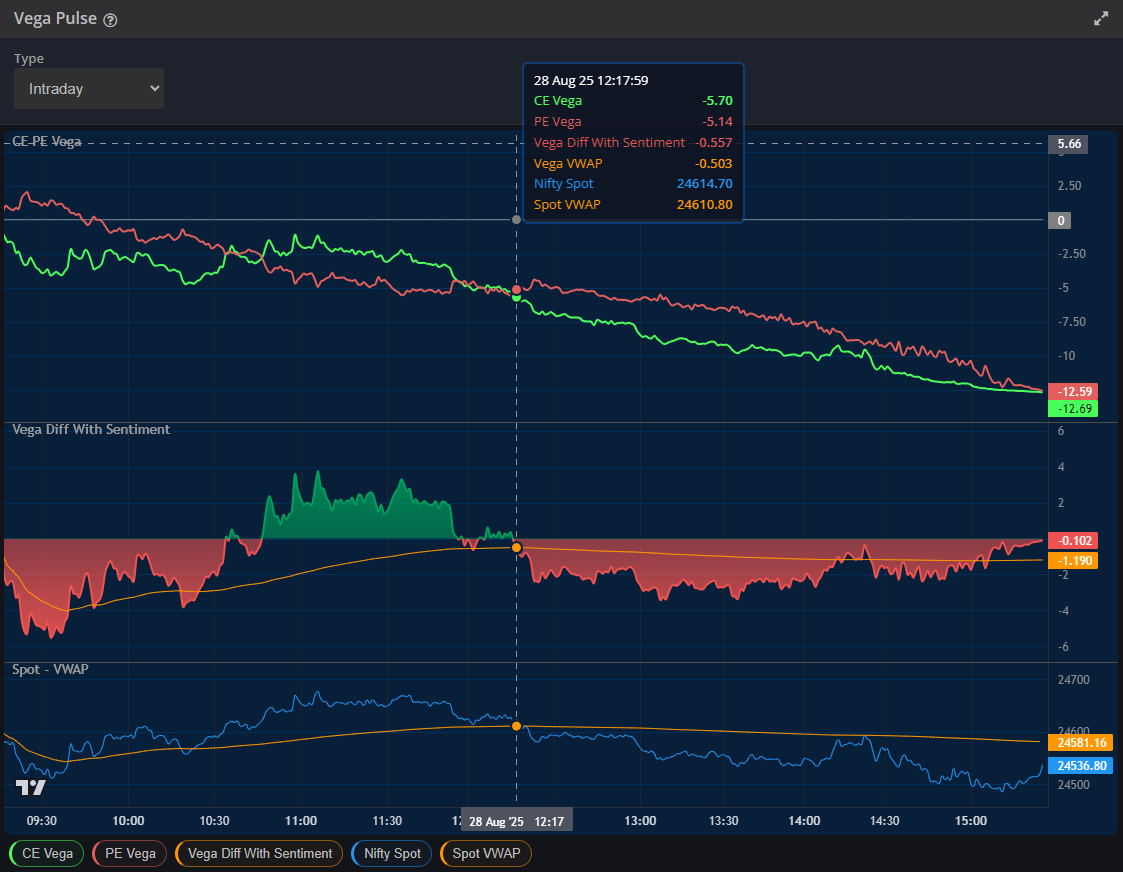
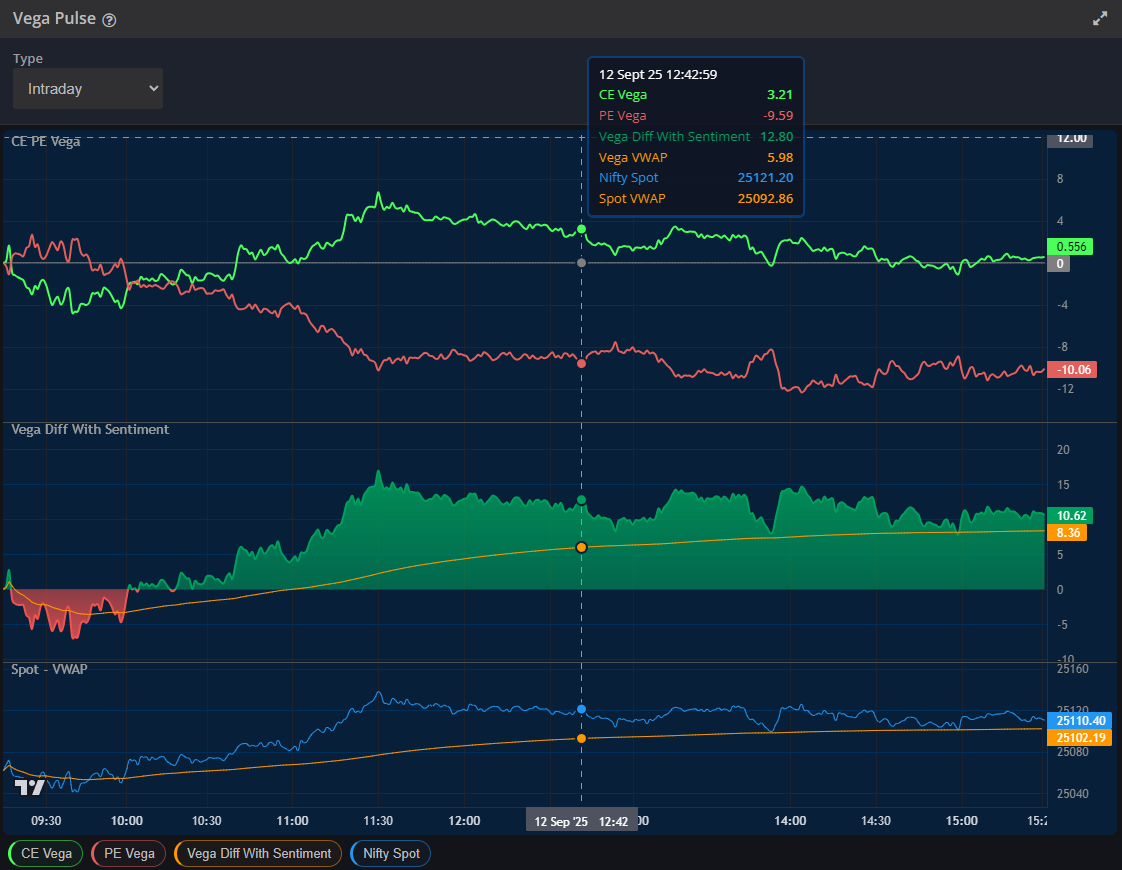
The Vega Pulse dashboard typically displays multiple components including CE Vega, PE Vega, Vega Difference with Sentiment, and VWAP levels, providing a holistic view of market volatility dynamics.
| Component | Description | Trading Significance |
|---|---|---|
| CE Vega | Volatility sensitivity of Call options | Indicates bullish volatility expectations |
| PE Vega | Volatility sensitivity of Put options | Shows bearish volatility positioning |
| Vega Diff with Sentiment | Net difference between CE and PE vega | Reveals overall market sentiment bias |
| Vega VWAP | Volume-weighted average price of vega | Provides fair value reference point |
The Vega Pulse charts display multiple timeframes and metrics simultaneously. The upper section shows individual CE and PE vega movements, while the lower section presents the combined sentiment analysis through the Vega Difference indicator.
The Market Direction indicator categorizes volatility sentiment into distinct ranges, helping traders understand the current market pulse:
| Direction | Value Range | Market Implication |
|---|---|---|
| Bullish | +8, +12, +16, +21, +28, +30 | Strong upward volatility bias, favoring calls |
| Sideways Bullish | +3, +4, +5, +6, +7 | Mild bullish sentiment with range-bound expectations |
| Sideways | +1, +3, +1, 0, -1, -2, -3 | Neutral volatility, balanced CE/PE demand |
| Sideways Bearish | -3, -4, -5, -6, -7 | Mild bearish tilt with limited downside expectations |
| Bearish | -8, -12, -16, -21, -28, -30 | Strong downward volatility preference, puts in demand |
When vega values are elevated:
When vega values are suppressed:
When CE and PE vega diverge significantly:
For long options, vega is always positive, meaning an increase in implied volatility raises the value of all options. This fundamental relationship forms the basis of advanced vega trading strategies.
Longer-term options tend to have higher vega than near-term options, creating opportunities for calendar spreads and volatility arbitrage.
The Vega Pulse tool becomes most valuable during:
| Market Condition | Vega Behavior | Recommended Action |
|---|---|---|
| Pre-Event Periods | Rising vega across all strikes | Consider volatility selling strategies |
| Market Stress | Skewed towards put vega | Monitor for reversal signals |
| Trending Markets | Directional vega bias | Align with momentum strategies |
| Range-Bound Markets | Balanced CE/PE vega | Implement neutral strategies |
High vega could mean larger profits if the market moves favorably, but it could also signify greater losses if the market swings unexpectedly. Understanding this dual nature is crucial for effective risk management.
Vega Risk Factors: Sudden volatility changes can significantly impact option values. Timing Risk: Volatility expansion may not occur as expected. Correlation Risk: Multiple positions may move together during market stress.
Vega Pulse analysis provides traders with a sophisticated framework for understanding and trading volatility. By monitoring CE vega, PE vega, sentiment indicators, and market direction signals, traders can make more informed decisions about option strategies and risk management.
The key to successful vega trading lies in understanding that volatility is mean-reverting over time, creating opportunities for both volatility buyers and sellers. Regular monitoring of the Vega Pulse dashboard, combined with proper risk management, can significantly enhance trading performance in options markets.
Remember that while vega analysis provides valuable insights, it should be combined with other technical and fundamental analysis tools for optimal trading results. The dynamic nature of implied volatility requires continuous monitoring and adaptation of trading strategies based on changing market conditions.