A straddle - strangle chart is a visual representation of a straddle options strategy, showing how the value of a combined call and put option changes in relation to the underlying asset's price fluctuations. It helps traders analyze potential profit or loss scenarios based on different price movements.
A straddle-strangle is one of the most popular neutral options trading strategies that allows traders to profit from significant price movements in either direction. This strategy involves simultaneously buying (or selling) both a call option and a put option with the same strike price or OTM same delta and expiration date. The straddle strategy is particularly effective when traders expect high volatility but are uncertain about the direction of the underlying asset's movement.
A long straddle involves buying both a call and put option at the same strike price. This strategy profits when the underlying asset moves significantly in either direction, beyond the combined premium paid.
A short straddle involves selling both a call and put option at the same strike price. This strategy profits when the underlying asset remains relatively stable, allowing the trader to collect the premium from both options.
| Component | CE Strike | PE Strike | Significance |
|---|---|---|---|
| Current Selection | 81500CE | 81500PE | At-the-money strikes for maximum gamma exposure |
| Alternative Strikes | Available range | Multiple options | Different risk-reward profiles |
| Expiration Impact | Same expiry | Same expiry | Consistent time decay analysis |
| Metric | Current Value | Description | Trading Significance |
|---|---|---|---|
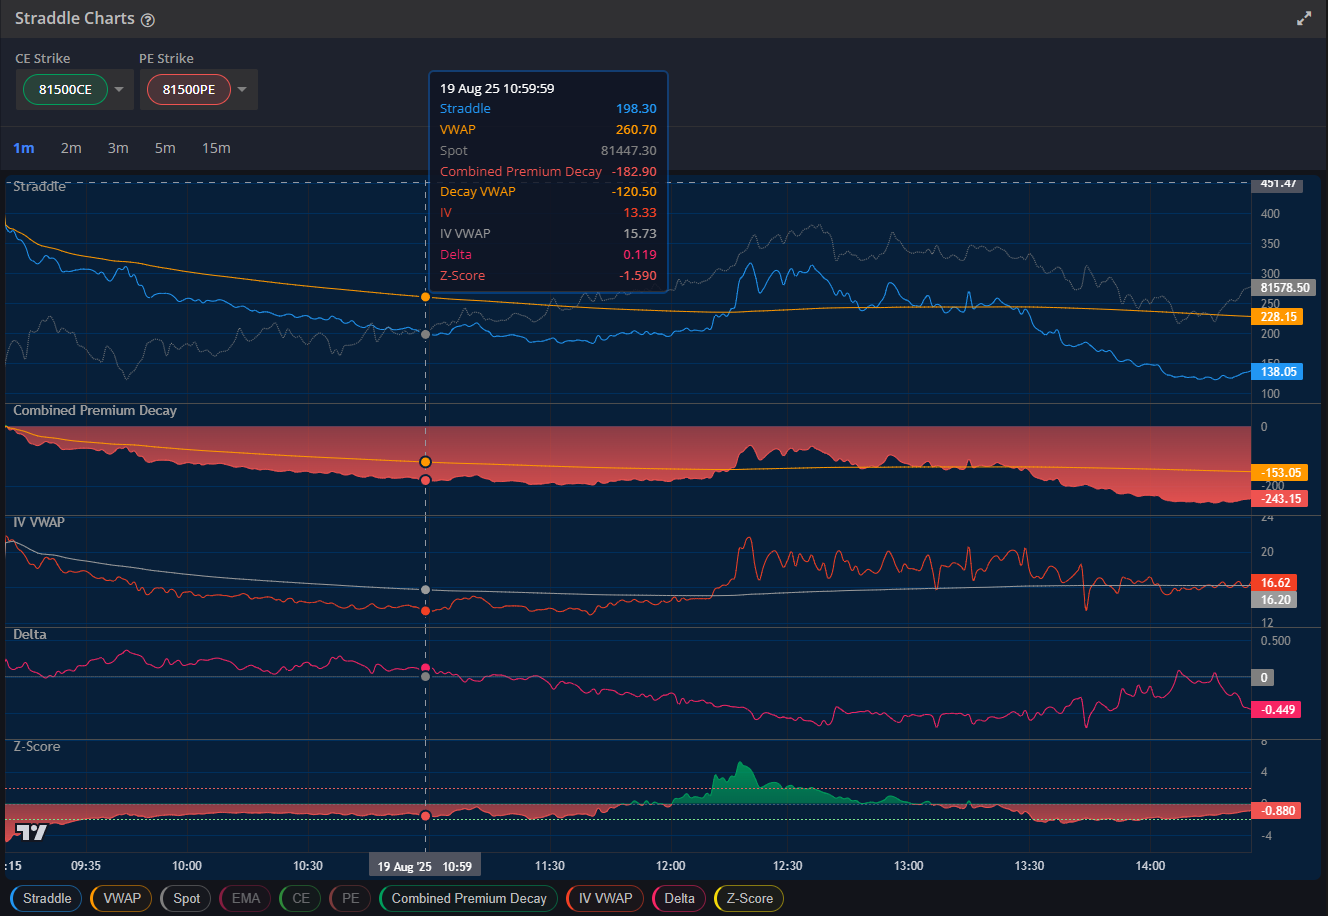
| Straddle Premium | 262.20 | Combined CE + PE premium | Total cost of long straddle position |
| VWAP | 314.32 | Volume Weighted Average Price | Fair value benchmark for entry/exit |
| Spot Price | 81418.80 | Current underlying price | Reference for moneyness calculation |
| Combined Premium Decay | -119 | Total premium erosion | Time decay impact on position |
Delta measures the rate of change in option price relative to underlying price movement. For a perfect at-the-money straddle or strangle:
The straddle strategy's success heavily depends on implied volatility and actual volatility dynamics:
| Volatility Metric | Current Value | Significance |
|---|---|---|
| IV (Implied Volatility) | 15.19 | Current volatility expectations priced into options |
| IV VWAP | 18.00 | Average IV throughout the trading session |
| Decay VWAP | -66.88 | Rate of volatility compression |
| Z-Score | -1.780 | Premiums below average (potentially attractive for buyers) |
The straddle chart displays various timeframes for comprehensive analysis:
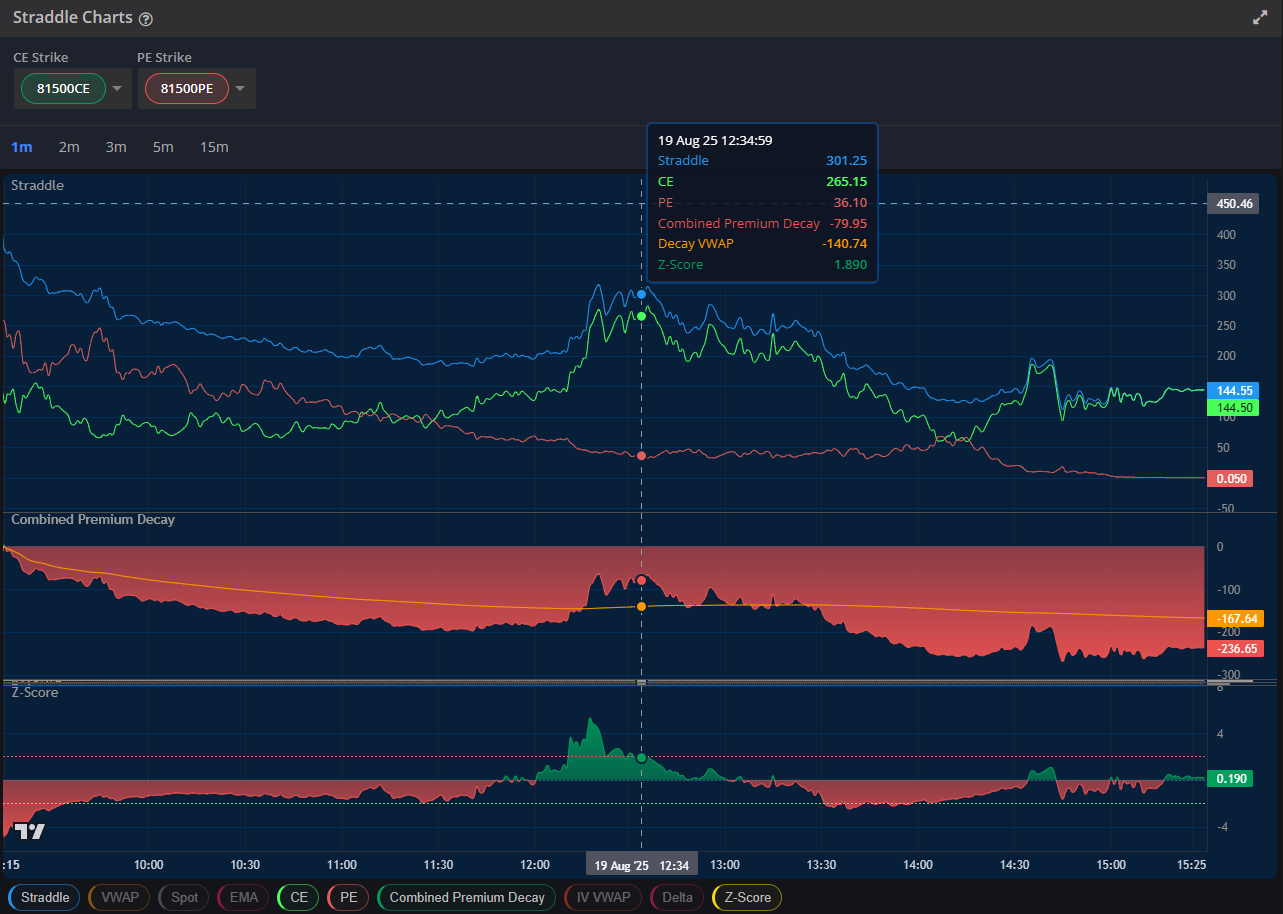
1. Main Straddle Line (Blue): Represents combined premium of CE and PE options. Current Level: 306.10 showing recent decline. Downward slope indicates premium compression with key levels at 242 and 187 zones.
2. Combined Premium Decay (Red Zone): Red color indicates negative premium decay. Current readings at -119.86 and -185.50 levels show significant time decay impacting position value.
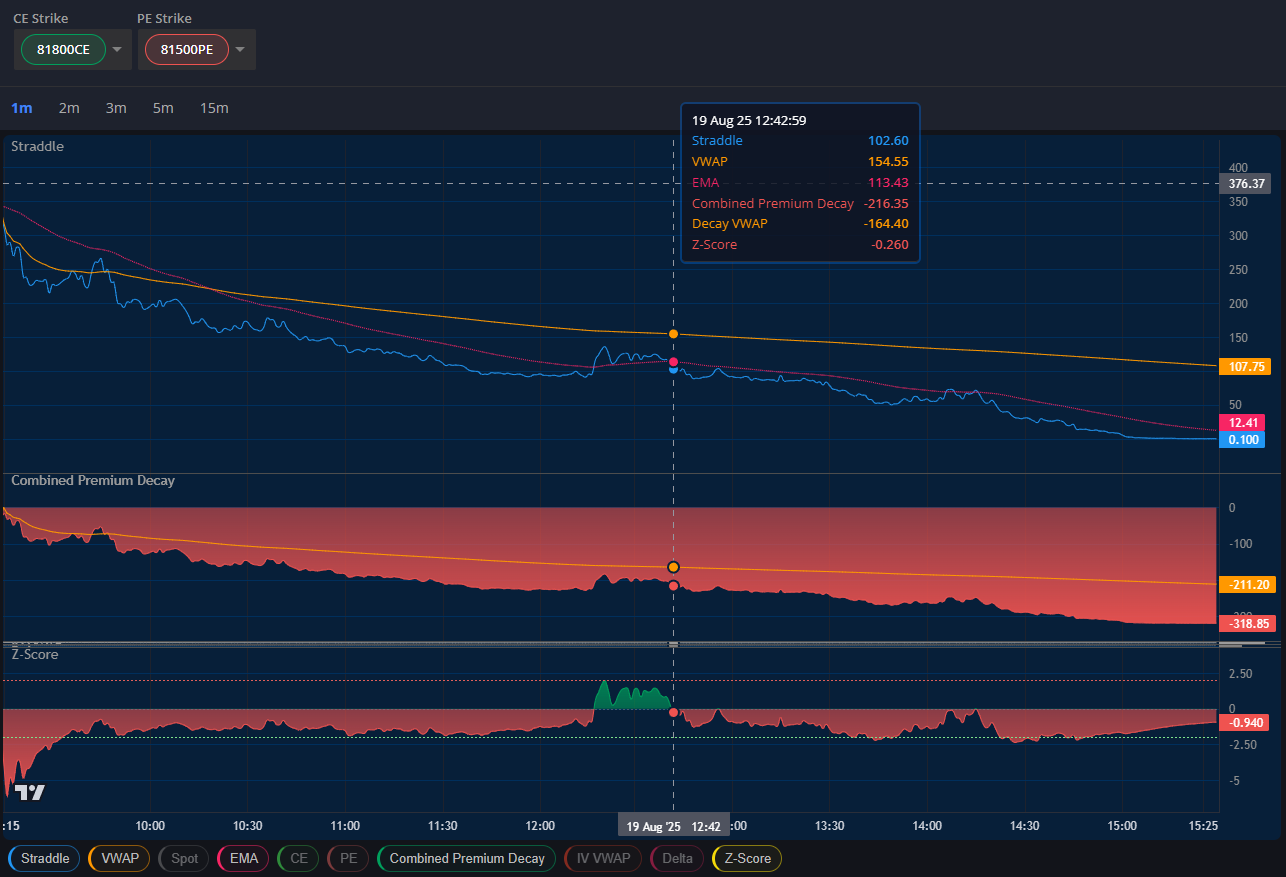
3. IV VWAP Section (Orange Line): Current level around 15.43-13.89 range with declining implied volatility trend. Lower IV may present straddle buying opportunities.
| Risk Factor | Management Technique | Implementation |
|---|---|---|
| Time Decay | Position sizing and timing | Avoid holding through final weeks |
| Volatility Risk | IV rank analysis | Trade in high IV environments |
| Directional Risk | Delta hedging | Adjust underlying exposure |
| Liquidity Risk | Strike selection | Choose liquid options contracts |
The straddle strategy performs best during specific market conditions:
Calendar Straddles: Using different expiration dates for enhanced flexibility. Diagonal Straddles: Combining different strikes and expiries for customized risk profiles. Ratio Straddles: Employing unequal numbers of calls and puts for directional bias.
The straddle options strategy represents a sophisticated approach to trading volatility rather than direction. Success requires careful analysis of multiple factors including implied volatility, time decay, delta positioning, and market timing.
By mastering these concepts and utilizing advanced charting tools, traders can effectively implement straddle strategies to capitalize on market volatility while managing associated risks.