Net Gamma Exposure (GEX) is the estimated value of gamma exposure that market makers must hedge for every 1% change in the underlying stock's price movement. A positive GEX indicates a long gamma position, while a negative GEX indicates a short gamma position.
Gamma Exposure (GEX) analysis provides crucial insights into options market microstructure, revealing how market makers' hedging activities influence underlying price movements. This comprehensive analysis examines the gamma exposure distribution across strike prices and its implications for trading strategies and market direction.
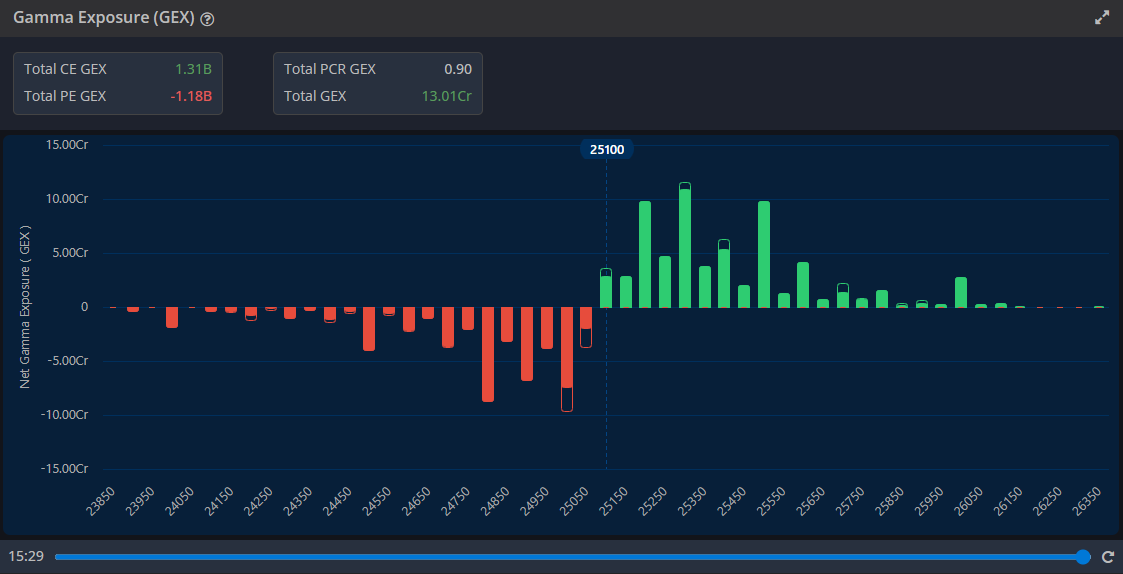
The gamma exposure chart reveals a distinctive pattern centered around the 25000 strike level, indicating significant market maker positioning and potential price magnetism effects. The distribution shows strong positive gamma above 25000 and negative gamma concentration below, creating important trading implications.
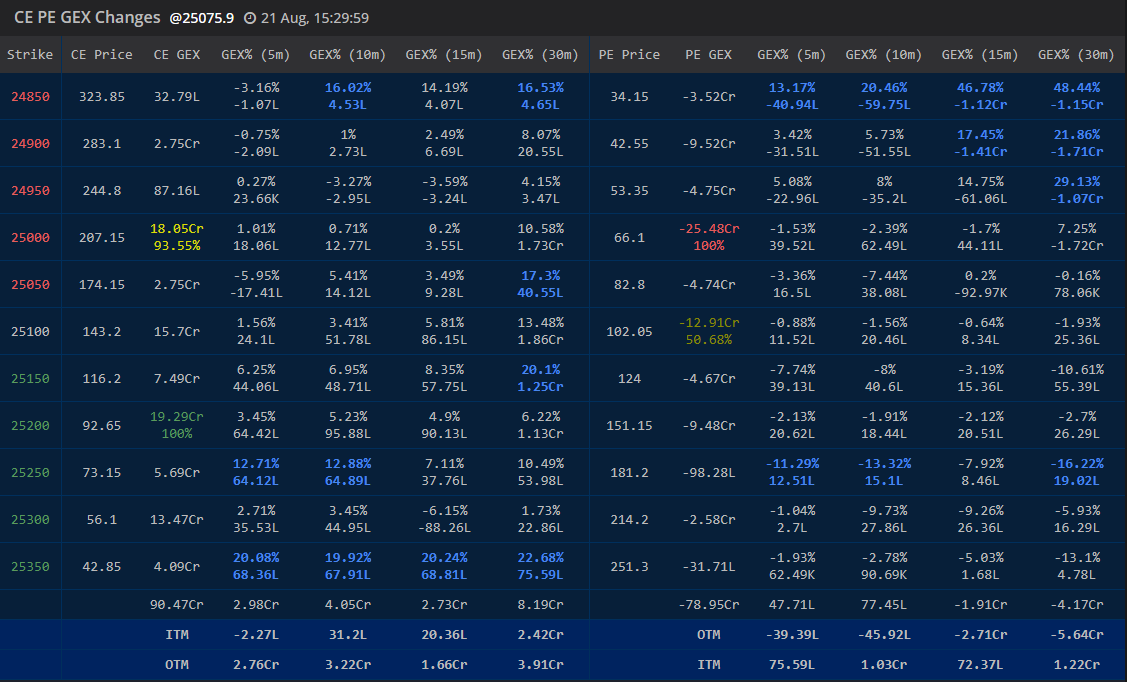
The comprehensive CE PE GEX changes data provides granular insights into how gamma exposure varies across different time frames and strike prices:
The gamma exposure distribution creates natural support and resistance zones that significantly influence price action. Understanding these zones is crucial for both short-term trading and longer-term positioning strategies.
| Zone Type | Strike Range | Net GEX | Market Impact | Trading Implication |
|---|---|---|---|---|
| Negative Gamma Zone | 24900-25000 | -7.5Cr Net | Accelerating moves, low stability | Momentum continuation likely |
| Gamma Flip Point | 25000 | 0 (Transition) | Maximum volatility zone | High-risk, high-reward area |
| Positive Gamma Zone | 25100-25300 | +12.8Cr Net | Price stabilization, mean reversion | Range-bound trading expected |
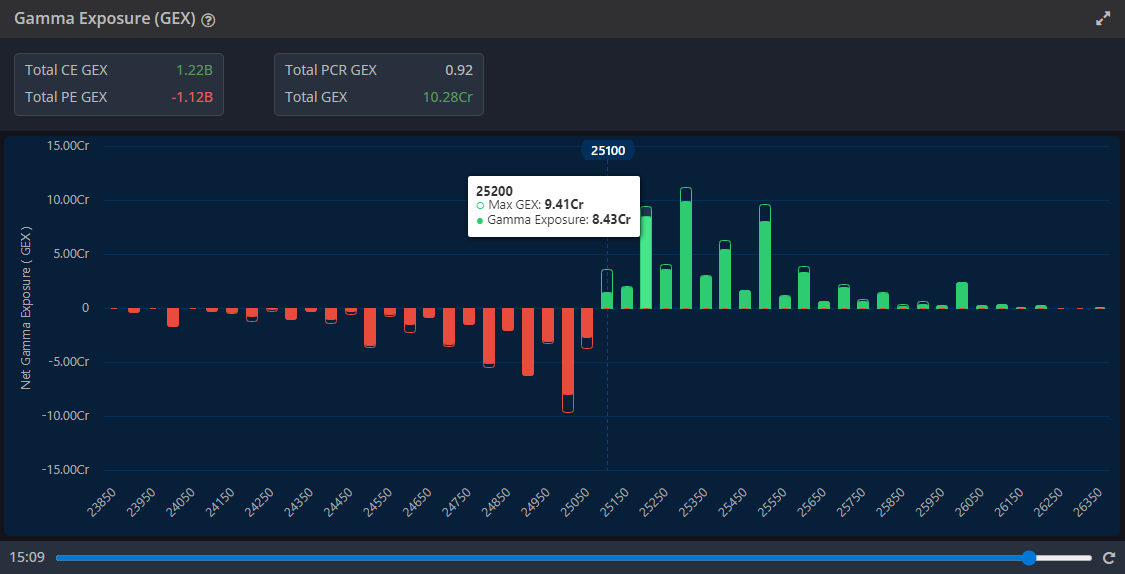
| Maximum GEX Zone | 25200 | +19.29Cr | Strong price magnetism effect | Potential resistance/target level |
The 5-minute, 10-minute, and 15-minute gamma changes reveal important insights about intraday momentum and market maker positioning adjustments:
Analysis of the time-based gamma changes identifies zones where acceleration in options positioning is occurring:
Market makers' hedging requirements based on current gamma exposure levels create predictable flow patterns that influence underlying price movements. Understanding these flows provides edge in directional trading and volatility strategies.
| Price Movement | Expected MM Flow | GEX Impact | Volatility Effect |
|---|---|---|---|
| Rally to 25200+ | Heavy Selling (Delta Hedging) | Positive GEX creates resistance | Volatility compression expected |
| Decline to 24950- | Accelerated Selling | Negative GEX amplifies moves | Volatility expansion likely |
| Range 25000-25100 | Balanced Flows | Transition zone dynamics | Elevated but contained volatility |
The current gamma exposure distribution suggests several strategic approaches for different market participants:
Critical Risk Factors: The current gamma distribution creates a high-risk environment around the 25000 level where negative gamma can accelerate moves beyond typical expectations. Position sizing should account for potential gap moves in this zone.
The net total GEX of 13.01Cr indicates overall positive gamma exposure in the system, suggesting that any sustained move higher could face increasing resistance from market maker hedging flows.
The PCR GEX ratio of 0.90 reveals important insights about market structure:
Gamma exposure analysis extends beyond individual instruments to sector-wide and market-wide effects. The current positioning suggests broader market implications for volatility and directional moves across related instruments and sectors.
The gamma distribution affects the entire volatility surface, creating opportunities in:
| Alert Level | Strike Price | Expected Action | Confidence Level |
|---|---|---|---|
| Major Resistance | 25200 | Heavy selling pressure from MM hedging | High |
| Gamma Flip | 25000 | Acceleration zone - momentum continuation | Very High |
| Support Test | 24950 | Negative gamma amplification on breaks | High |
| Extension Target | 25300 | Secondary resistance from positive gamma | Medium |
The comprehensive gamma exposure analysis reveals a market structure heavily influenced by the 25000 strike level, creating a critical decision point for future price action. The combination of positive total GEX (13.01Cr) with negative gamma concentration around current levels suggests a complex trading environment requiring careful risk management.
Successful navigation of this gamma landscape requires understanding both the mechanical aspects of market maker hedging and the behavioral implications of options positioning. Traders should monitor gamma changes in real-time while maintaining awareness of the broader market structure implications revealed by this analysis.
Risk Disclosure: Gamma exposure analysis provides insights into market structure but does not guarantee future price movements. Options trading involves substantial risk and requires thorough understanding of complex market dynamics. Always consider your risk tolerance and investment objectives before implementing gamma-based strategies.