Master Open Interest Analysis for smarter options trading decisions with comprehensive interpretation techniques and actionable insights.
Open Interest (OI) Analysis is a fundamental technique in options trading that examines the total number of outstanding option contracts that have not been settled or closed. Unlike trading volume, which represents the number of contracts traded in a specific period, Open Interest provides insight into the flow of money into and out of specific option contracts, making it a powerful tool for predicting market direction and sentiment.
OI Analysis helps traders understand market dynamics by revealing where institutional money is positioned, identifying support and resistance levels, and gauging the strength of price movements. When combined with price action and volume analysis, Open Interest becomes an invaluable component of a comprehensive trading strategy.
Key Insight Open Interest represents the commitment of market participants. Rising OI with rising prices indicates bullish sentiment, while rising OI with falling prices suggests bearish momentum.

Represents the total outstanding call options at various strike prices. High CE OI at specific strikes often indicates strong resistance levels where sellers are positioned.
Shows total outstanding put options across strike prices. Elevated PE OI typically indicates support levels where buyers are concentrated.
The ratio of total Put OI to total Call OI, providing a quick sentiment gauge for the overall market or specific strike prices.
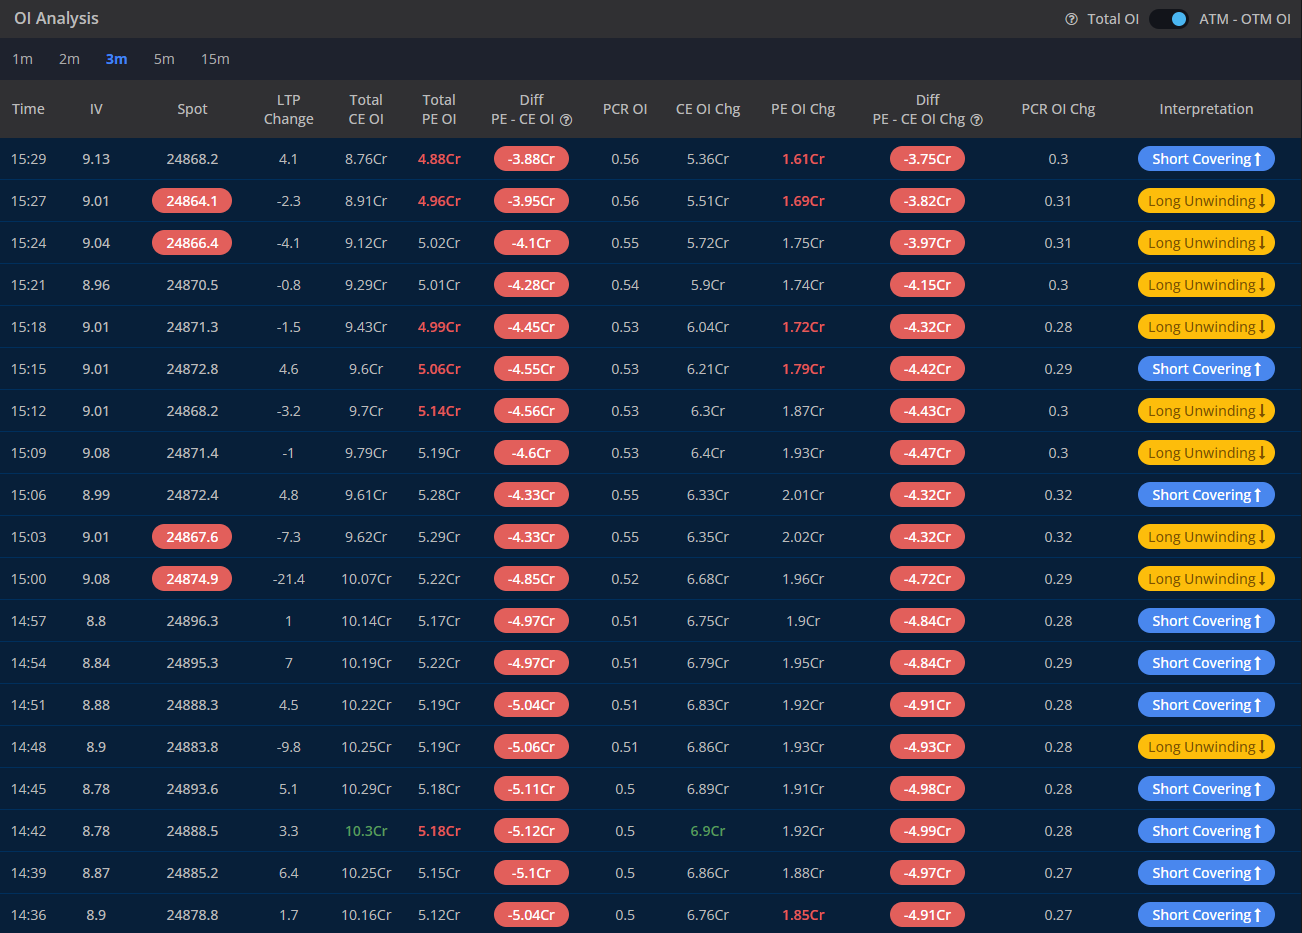
Understanding how to read and interpret OI analysis tables is crucial for making informed trading decisions. Below is a comprehensive breakdown of key metrics and their interpretations:
| Time | Spot Price | Total CE OI | Total PE OI | PCR OI | CE OI Change | PE OI Change | Interpretation | Signal Strength |
|---|---|---|---|---|---|---|---|---|
| 15:30 | 24,850 | 8.76Cr | 4.88Cr | 0.56 | +5.36Cr | +1.61Cr | Strong Bullish | High |
| 15:25 | 24,840 | 9.12Cr | 5.02Cr | 0.55 | -2.15Cr | +3.45Cr | Bearish Momentum | Medium |
| 15:20 | 24,870 | 9.29Cr | 5.01Cr | 0.54 | +1.12Cr | +1.08Cr | Sideways/Neutral | Low |
| 15:15 | 24,872 | 9.60Cr | 5.06Cr | 0.53 | +4.25Cr | +1.15Cr | Moderate Bullish | Medium |
Combining Open Interest with volume data provides deeper insights into market sentiment and the sustainability of price moves. High volume with increasing OI suggests new positions, while high volume with decreasing OI indicates position closing.
Analyzing OI distribution across different strike prices helps identify key support and resistance levels. Maximum Call OI often acts as resistance, while Maximum Put OI typically provides support.
As expiration approaches, OI naturally decreases due to time decay and position rolling. Understanding this pattern helps differentiate between natural OI reduction and genuine sentiment changes.
Studying historical OI patterns during similar market conditions can provide valuable insights for predicting future price movements and identifying recurring market behaviors.
Pro Tip: Always analyze OI in conjunction with price action, implied volatility, and market fundamentals for the most accurate trading signals. No single indicator should be used in isolation.
OI changes without corresponding volume can be misleading. Always verify OI changes with trading volume for reliable signals.
Focusing only on intraday OI changes without considering broader trends can lead to false signals and poor trading decisions.
Failing to account for expiry-related OI changes can result in misinterpreting natural position adjustments as sentiment shifts.
Use maximum OI levels to identify key support and resistance zones. Enter long positions near high PE OI levels (support) and short positions near high CE OI levels (resistance).
When PCR reaches extreme levels (below 0.5 or above 1.5), consider contrarian positions as these often indicate market extremes ready for reversal.
Trade in the direction of significant OI unwinding. Put unwinding with rising prices suggests continued bullish momentum, while call unwinding with falling prices indicates bearish continuation.
Successful OI analysis requires patience, practice, and continuous learning. Start with paper trading to test your interpretations before risking real capital, and always maintain proper risk management protocols.
Take your options trading to the next level with our comprehensive OI analysis tools and real-time market insights. Join thousands of traders who use our platform for smarter trading decisions.