Using the straddle chain approach, an investor takes positions in both a call and a put with the same strike price and maturity date.
The straddle chain provides comprehensive data across multiple strike prices, enabling traders to analyze the complete options landscape for strategic positioning. This analysis covers strike prices from 24700 to 25400, revealing critical insights about volatility, time decay, and optimal entry points for straddle strategies.
The following table presents the complete straddle chain with all critical metrics for informed trading decisions:
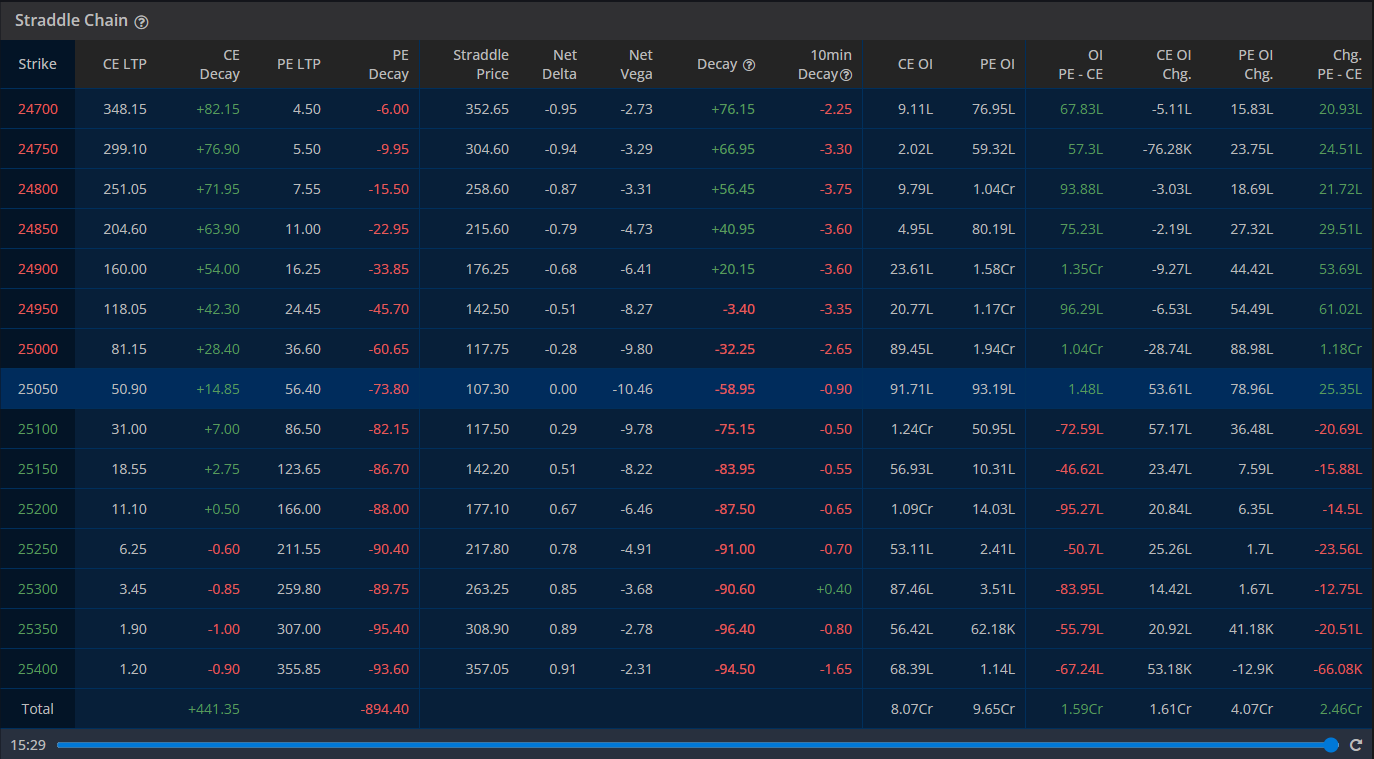
The 25000 strike appears closest to at-the-money based on the balanced call and put pricing structure. Key characteristics include:
Based on the comprehensive chain analysis, different strikes serve various strategic purposes:
| Strategy Type | Recommended Strike | Straddle Cost | Breakeven Range | Risk Profile |
|---|---|---|---|---|
| Conservative Straddle | 25050 | 107.3 | 24942.70 - 25157.30 | Lower cost, moderate profit potential |
| Balanced Straddle | 25000 | 117.75 | 24882.25 - 25117.75 | Optimal delta neutrality |
| Aggressive Straddle | 24950 | 142.5 | 24807.50 - 25092.50 | Higher cost, wider breakeven range |
The delta progression across strikes reveals important insights about directional sensitivity:
Vega analysis reveals how different strikes respond to volatility changes, crucial for volatility trading strategies:
Time decay analysis reveals critical insights about the cost of maintaining straddle positions across different strikes. The decay patterns show both daily and 10-minute decay rates, enabling precise timing strategies.
| Strike Range | Average Daily Decay | Decay Intensity | Strategic Implication |
|---|---|---|---|
| 24700-24850 | +45.88 | Low (ITM Protection) | Intrinsic value cushions time decay |
| 24900-25000 | -5.17 | Moderate (ATM Zone) | Balanced decay with maximum optionality |
| 25050-25150 | -72.70 | High (OTM Vulnerability) | Requires significant moves to overcome decay |
| 25200-25400 | -90.90 | Very High (Deep OTM) | Exponential decay acceleration |
Open interest distribution provides insights into market positioning and liquidity across different strike prices:
Based on the comprehensive chain analysis, several strategic approaches emerge for different market scenarios:
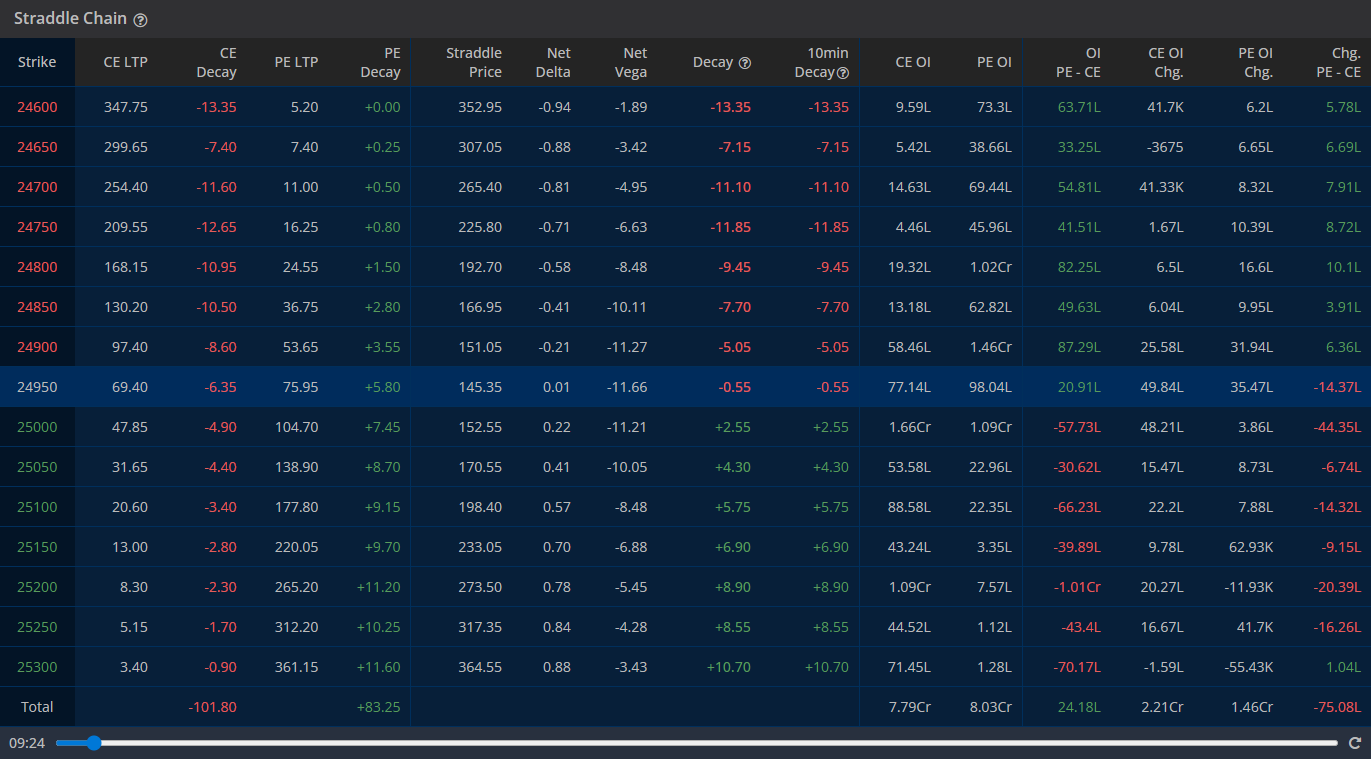
Market Timing Consideration: Current time stamp (15:29) suggests late-session data. Consider how closing auction and overnight risks might affect positions before implementing strategies.
| Market Scenario | Recommended Strategy | Strike Selection | Expected Outcome |
|---|---|---|---|
| Low Volatility Expansion | Long Straddle | 25050 (Delta Neutral) | Profit from volatility increase |
| High Volatility Contraction | Short Straddle | 25000 (ATM) | Collect premium from volatility crush |
| Directional Bias (Bullish) | Modified Straddle | 24950 (Slightly ITM) | Benefit from upward movement |
| Range-Bound Market | Iron Condor | 25000 Center | Profit from sideways movement |
Effective risk management requires careful consideration of position sizing based on volatility expectations and account size:
The put-call pricing relationship across strikes reveals important market sentiment indicators:
Analysis of the CE and PE pricing structure suggests a slight put skew, indicating underlying bearish sentiment or hedging demand. This creates opportunities for volatility traders who can capitalize on skew normalization.
The 10-minute decay percentages provide real-time insight into accelerating time decay throughout the trading session, enabling tactical adjustments:
The comprehensive straddle chain analysis reveals a complex landscape of opportunities and risks across the 24700-25400 strike range. The 25000-25050 strike zone emerges as the optimal area for most neutral strategies, offering the best balance of delta neutrality, vega sensitivity, and manageable time decay.
Successful implementation requires continuous monitoring of the Greeks, particularly delta and vega changes, while maintaining strict discipline around time decay management. The high open interest at key strikes provides adequate liquidity for most trading strategies, though execution timing remains crucial given the accelerating nature of option decay.
Final Risk Disclaimer: Options trading involves substantial risk and is not suitable for all investors. The strategies discussed require advanced understanding of options mechanics, Greeks behavior, and market dynamics. Always consider your risk tolerance and investment objectives before implementing any options strategy.